The top could be in place how you say I have no doubt about it, but how someday I tell you I use RSI weekly to count cycles and to me we are in a new cycle that has not finished yet. When the market breaks that support I will change the count as you have
Ignored
Hi Luis,
hope you had a nice weekend :-)
Naa, my word is not the bible. And especially not with the recent wave mess LOL
I primarily was concerned with the counting of the internals of wave W
I was looking some EW blogs, and everybody is talking about the triangle at euro dollar, in my experience I prefer to take the waves as a FLAT than a triangle. I always took the triangle as last possibility.
Ignored
Very right, I hate it when people fantasize about triangles when only A and B are finished....
I was looking some EW blogs, and everybody is talking about the triangle at euro dollar, in my experience I prefer to take the waves as a FLAT than a triangle. I always took the triangle as last possibility.
----------------------------------------------------- ----------------------------------
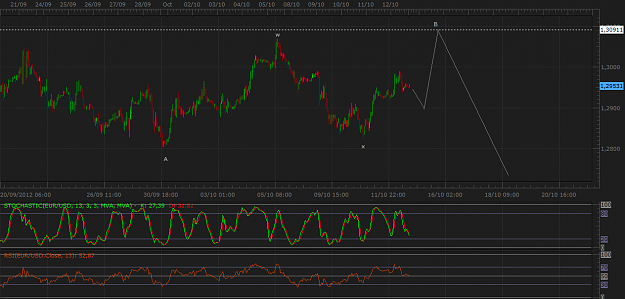
Here is a 240 min chart .........Price-action appears to have been moving downward recently
Where is it going from here ? ,,,,,, Only time will tell ! ....
By the way I am looking lower for the euro. I did put up the idea of a triangle forming on th daily chart. Another count is an abc decline fron the top. This should show up as a 5-3-5 move. the 1.30xx to 1.2850 move can be construed as a 5 move down. Then the 2850 to 1.3000 move can be 3 waves. I believe we are on the way down. If 1.2800 is taken out then the triangle probability is out of the window and 1.2700 might be a possible target. Then I would expect a serous upmove...
Just my thoughts...
Olu
If you think you can or cannot do it you are correct
By the way I am looking lower for the euro. I did put up the idea of a triangle forming on th daily chart. Another count is an abc decline fron the top. This should show up as a 5-3-5 move. the 1.30xx to 1.2850 move can be construed as a 5 move down. Then the 2850 to 1.3000 move can be 3 waves. I believe we are on the way down. If 1.2800 is taken out then the triangle probability is out of the window and 1.2700 might be a possible target. Then I would expect a serous upmove...