• Home
  • Forums
  • Trades
  • News
  • Calendar
  • Market
  • Brokers
  • Login
  • Join
  • User/Email: Password:
  • 4:13am
Menu
  • Forums
  • Trades
  • News
  • Calendar
  • Market
  • Brokers
  • Login
  • Join
  • 4:13am
Sister Sites
  • Metals Mine
  • Energy EXCH
  • Crypto Craft

Options

Bookmark Thread

First Page First Unread Last Page Last Post

Print Thread

Similar Threads

Automatic Elliott Wave Counting & Analysis 10 replies

Can anyone help me with counting Elliott waves 1 reply

The Basics of Elliott Wave Theory 128 replies

Is there any website show the elliott counting? 8 replies

Elliott Wave Counting DJIA 0 replies

  • Interactive Trading
  • /
  • Reply to Thread
  • Subscribe
  • 2,101
Attachments: Elliott Wave Counting with EG
Exit Attachments
Tags: Elliott Wave Counting with EG
Cancel

Elliott Wave Counting with EG

  • Last Post
  •  
  • Page 1 23456 142
  • Page 1 2 142
  •  
  • Post #1
  • Quote
  • First Post: Edited Feb 1, 2008 8:01pm Mar 7, 2007 5:56am | Edited Feb 1, 2008 8:01pm
  •  el grande
  • | Joined Nov 2006 | Status: Member | 2,021 Posts
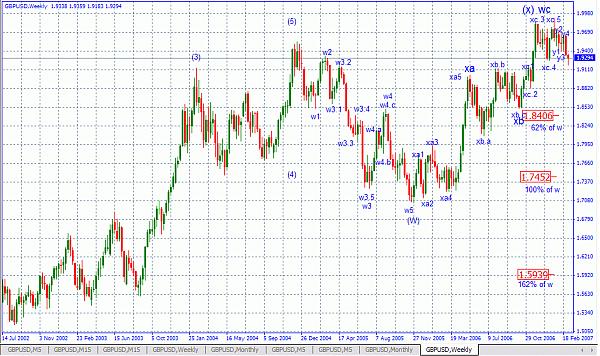
I often find myself going back to Elliot Wave Counting when I embark on analysing Cable Position. I basically trade the Cable so I will focus on this pair for analysis using Elliot Wave Theory.

I do not pretend that I know a lot. But I will attempt to post my EW analysis at least 3 times a week. There used to be a broker with a comprehensive EW Analysis from which I used to refer to. Now that they have stopped this section, I find myself forced to do it on my own.

You are free to point out details which may be discrepant in terms of the original rules. One thing I have learned to accept when using EW, it is never always definite. It only provides a potential direction. And it is very important that it is done often to be able to adjust counts if halfway thru the count we discover that it has broken some rules forcing us to adjust the counting.

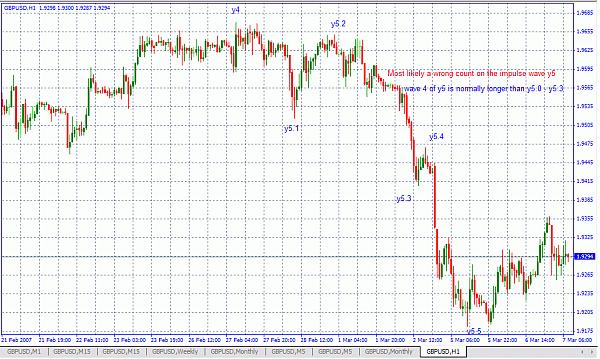
I will be posting charts with some details on them. I start of with the weekly chart. You will notice that I employ my own sub numbering or labelling to help me identify from where the wave count is based. This is evident on the smaller time frame of 1H.

I try to determine the wave counts on lower time frames when ever possible.

EG

Basics of Elliott Wave Principles

Corrective Wave Patterns_Summarized Form Part 1
Based on Figures gathered from Elliott Wave International reference material.

Attached is a summarized form of corrective wave patterns. There are still some variations specially on the complex side. But I will try to gather some more so I can post them here.

The summary below can be sued as a reference in my assessment of the EURUSD potential direction.

As you can see in my Daily and 4hour charts even from Last Friday yet before that plunge, Price assessment was considered to be in the downward direction and there were 4 suggested potential patterns.

Basically, we had a 3wave structure for the 1st leg A from 1.4966 down to 1.4309. So if you look @ the possible options for a cortrective wave , we cannot have the basic zigzag because the wave A leg should be in 5 waves and this is only 3 waves.

So the next option is the Flat or the triangle. But technically we can not have the flat because wave 2 was already a flat .

Then that leaves us with the triangle option which as you will see would fit into the the pattern that has 3 waves for the wave "a" then now we see 3 waves up for the wave "b". As for the succeeding waves which should all be in 3 wave structures also, we will have to see 3 more ( waves c d and e ) then a breakout from the triangle.

In my Daily and 4hour chart , first you will see the Running Flat. I expected that first just incase price forms a 3 wave structure down from 1.4921 down to somewhere around 1.4561 which was the FE 200.00 from 1.4921 then bounce to go higher than 1.4921. That would have been a running FLAT.

However, Price has continued to form and finish 5 waves down to 1.4589 then retraced and expanded sideways which could now form wave C down after it finished the waves A and B.

Which is why I am nect looking at price bouncing off either of those 2 magenta trendlines which were constructed using Low points on the left side of the chart. FE 300.00 @ 1.4413 falls near the level of 1 of the magenta trendlines for the triangle.

If high of 1.4714 is considered as the end of an X wave and if I see 5 waves are formed going down towards FE 300.0 @ 1.4413 and bouncing off that magenta trendline, then next to look for are 2 more legs which 1st would bounce up to the upper side of the visualized triangle then another bounce backdown to the lower nagenta line to complete what is possibly the 5 legs of the triangle.

I would trade a breakout at the top side of the triangle for my Long trade.

However, if price from 1.4714 continues to go down and breaksout to the downside of 1.4413 , it is more likely that a triangle is off the table and a more complex corrective wave may be forming or even a bigger zigzag wave which could see price going towards 1.4267 or even lower towards 1.3862 or even 1.3208 based on the FIB Projection using the relationship of wave C to wave A.

EG

A Flat will most likely not be seen because of the Rule of Alternation
Attached Thumbnailshttp://www.forexfactory.com/attachme...1&d=1200893086
  • Post #2
  • Quote
  • Mar 7, 2007 6:02am Mar 7, 2007 6:02am
  •  Traex
  • | Joined Sep 2006 | Status: Forex Newbie | 1,517 Posts
Hi EG,
I'm looking forward to seeing your wave count charts here. Thanks.
Tra-X
 
 
  • Post #3
  • Quote
  • Edited 6:54am Mar 7, 2007 6:08am | Edited 6:54am
  •  el grande
  • | Joined Nov 2006 | Status: Member | 2,021 Posts
I picked this up from the Broker before.

Based on the monthly count, it would look like we have already reached the maximum or the top for the wave X which is the second wave of a 3 wave ( WXY ) B wave. So we are now looking at achieving the completion of wave y which is going south.
Attached Image
 
 
  • Post #4
  • Quote
  • Edited 6:58am Mar 7, 2007 6:10am | Edited 6:58am
  •  el grande
  • | Joined Nov 2006 | Status: Member | 2,021 Posts
Attached is the Weekly Count.

Now moving in for a closer look and count, here in the weekly chart, we can see that the wave w down was a 5 wave movement while the wave x was an ABC move.

Wave y is expected to make a 5 wave movement down.

Overall, wave y is expected to be 62%, 100% or 162% of wave w. You can see the approximate values of the Final wave Y target on the right side of the chart.

EG
Attached Image
 
 
  • Post #5
  • Quote
  • Edited 7:00am Mar 7, 2007 6:16am | Edited 7:00am
  •  el grande
  • | Joined Nov 2006 | Status: Member | 2,021 Posts
Resolution is not really good. you will need to download it and view it in your graphics software if you are interested. I will post some discussion re the chart once I finish uploading all the charts.

From the Daily Chart we can see better how this is to be accomplished or how we would see things unfold.

EG
Attached Image
 
 
  • Post #6
  • Quote
  • Edited 7:03am Mar 7, 2007 6:18am | Edited 7:03am
  •  el grande
  • | Joined Nov 2006 | Status: Member | 2,021 Posts
4H Charts

On the 4H chart we see now where the wave X topped which is in the week of January 23, 2007.

How could I have missed this? This mistake cost me a lot. Anyway, on with this pursuit of counting waves. This is one of the reasons why I am setting this up. I have to force myself to regularly analyze the charts using EW.

EW is not easy which is why it is very easy to succumb to technical analysis as there are a lot of indicators available. However, even if this is going to be a challenge, it will be something worth doing and learning.

EG
Attached Image
 
 
  • Post #7
  • Quote
  • Mar 7, 2007 6:20am Mar 7, 2007 6:20am
  •  el grande
  • | Joined Nov 2006 | Status: Member | 2,021 Posts
This is probably where I went wrong last week.
Attached Image
 
 
  • Post #8
  • Quote
  • Mar 7, 2007 6:22am Mar 7, 2007 6:22am
  •  el grande
  • | Joined Nov 2006 | Status: Member | 2,021 Posts
Here is the revised wave count for the Cable.
Attached Image
 
 
  • Post #9
  • Quote
  • Mar 7, 2007 6:28am Mar 7, 2007 6:28am
  •  el grande
  • | Joined Nov 2006 | Status: Member | 2,021 Posts
This is where I see the Cable going. South.
Attached Image
 
 
  • Post #10
  • Quote
  • Edited 7:18am Mar 7, 2007 6:30am | Edited 7:18am
  •  el grande
  • | Joined Nov 2006 | Status: Member | 2,021 Posts
Hopefully this is clearer.

I believe we are now on the way to complete a wave 3 inside a wave 5 inside wave Y.

I hope I did not lose you there. You will see on the chart where I labelled y5.4. This means that we are in a wave Y.

And the wave Y is composed of 5 waves. and now we are in the making of a wave 5 of wave Y.

Inside wave Y, we have already finished 4 waves and now we are on the last leg which is the y5 or the 5th wave in wave y.

Of the 5 waves in wave y, we have finished 4 waves y41 to y54. we just started wave y55.

But wave y55 is actually wave 5 of y which is divided into 5 waves. That is y551 to y555.

We have finished wave y5.51 and y552. We are now on y553.

And because we are now moving south. my SLs would be
Tight @ highest of y552
Relaxed @ highest of y551

This y553 will be a long one so happy pipping everyone.

Remember that we will have retrace at y554. then we will continue down for y555 and that is supposed to be the end point of wave y which is also the Big Wave B.

From there ..... it will be UP for the Big wave C.

EG
Attached Image
 
 
  • Post #11
  • Quote
  • Mar 7, 2007 6:32am Mar 7, 2007 6:32am
  •  el grande
  • | Joined Nov 2006 | Status: Member | 2,021 Posts
For now, anybody who wants to reply here..... kindly use the ICON POST REPLY and NOT the QUOTE.

So that I can still inject some discussions on the post with the respective charts.

Thanks
EG
 
 
  • Post #12
  • Quote
  • Mar 7, 2007 7:23am Mar 7, 2007 7:23am
  •  el grande
  • | Joined Nov 2006 | Status: Member | 2,021 Posts
Quoting Traex
Disliked
Hi EG,
I'm looking forward to seeing your wave count charts here. Thanks.
Ignored

Hello Traex.

You are welcome. I hope we can all have a nice discussion here and hopefully it becomes profitable for all of us too.

EG
 
 
  • Post #13
  • Quote
  • Mar 8, 2007 12:45pm Mar 8, 2007 12:45pm
  •  John-Paul
  • | Joined Nov 2006 | Status: Learnin' N' Tryin | 21 Posts
Hi El,

I've always wanted to learn 'bout the EW analysis......

I'm relatively new to it....In ur opinion, does EW work as many tout it?

I'd be glad 2 have u help me with some resources to aid my comprehension of the technique.....

Keep up the good work....

John-Paul
I grumbled I had no shoes until I met a man who had no toes...
 
 
  • Post #14
  • Quote
  • Mar 8, 2007 12:54pm Mar 8, 2007 12:54pm
  •  MarkGavalda
  • | Joined Feb 2007 | Status: Forex Warrior | 187 Posts
Thank you el grande for sharing your views with us, I like a lot what you're doing! I'm starting to be an EW fan, though I only know a little about it yet, but some books are already on their way from eBay to me
Today wasn't a really good, trending day, let's hope tomorrow price will start to make it's 130 pips range in a trend

Thanks again,
Mark
 
 
  • Post #15
  • Quote
  • Mar 8, 2007 6:57pm Mar 8, 2007 6:57pm
  •  ahmaddewa85
  • | Joined Feb 2007 | Status: Member | 3 Posts
Hi EG
Thanks for your sharing. I'm interested in learning EW analysis.
At what point is wave B is ending?
To what point is wave C is going to?
Should we combine EW with fib ret in order to predict the beginning and the ending of each wave?
Thanks
 
 
  • Post #16
  • Quote
  • Mar 9, 2007 10:58am Mar 9, 2007 10:58am
  •  el grande
  • | Joined Nov 2006 | Status: Member | 2,021 Posts
Quoting John-Paul
Disliked
Hi El,

I've always wanted to learn 'bout the EW analysis......

I'm relatively new to it....In ur opinion, does EW work as many tout it?

I'd be glad 2 have u help me with some resources to aid my comprehension of the technique.....

Keep up the good work....

John-Paul
Ignored
Hi JP.

Please remember that I too am still learning EW. It will do you very well if you visit the threads by Itme and fixme1too. They discuss and share a lot on EW in their threads. I refer to their posts for my readings aside from what is available everywhere.

In my opinion, we can refer to EW for potential direction. But applying them to Cable is going to be a bit tough specially if you are a Day Trader due to Cable's high volatility. Cable can retrace more than 100% of a particular move and yet it still pursues the original EW Target.

I refer to EW for longer term potential direction. While I try to breakdown each wave in the higher timeframes into smaller wave formations in the lower time frames, it can sometimes get confusing. But in time I hope I can master that.

I would then suggest not to use EW for Day Traders. But Intraday traders will do well with it incombination with other indicators.

EG
 
 
  • Post #17
  • Quote
  • Mar 9, 2007 11:02am Mar 9, 2007 11:02am
  •  el grande
  • | Joined Nov 2006 | Status: Member | 2,021 Posts
Quoting MarkGavalda
Disliked
Thank you el grande for sharing your views with us, I like a lot what you're doing! I'm starting to be an EW fan, though I only know a little about it yet, but some books are already on their way from eBay to me
Today wasn't a really good, trending day, let's hope tomorrow price will start to make it's 130 pips range in a trend

Thanks again,
Mark
Ignored
Hello Mark.

You can take a look at the threads of the 2 members I mentioned in the post above. They have very good discussion and shared materials.

As to trending and ranging markets...... well, I would like to master that .

EG
 
 
  • Post #18
  • Quote
  • Mar 9, 2007 11:20am Mar 9, 2007 11:20am
  •  el grande
  • | Joined Nov 2006 | Status: Member | 2,021 Posts
Quoting ahmaddewa85
Disliked
Hi EG
Thanks for your sharing. I'm interested in learning EW analysis.
At what point is wave B is ending?
To what point is wave C is going to?
Should we combine EW with fib ret in order to predict the beginning and the ending of each wave?
Thanks
Ignored
Hello ahmaddewa85.

I really do not have precise values for the B right now. But as you can see in the last chart I posted..... those are approximate values as to where I think this would go. there is the 62% , 100% and the 162% of A.

Please remember that these are potential targets and not really definite. Another thing to remember is that Cable is very volatile. Refer to my post earlier.

As to the C wave, I have included that in the monthly chart as a potential forward look. But that will only happen if we are correct on the B. Otherwise, EW count will have to be revised.

If I were you, I will not think of Wave C yet. Wave B I think will still take some time to finish. I do not think we have achieved the bottom of this wave yet. Look at other indicators in different time frames and you will see that Cable is either almost over bought or already over-bought. So we should see it going down now for this pair. But I still could be wrong.

Also remember that there are still too many pips to harvest ..... way too many in fact..... before we finish with this B. In 1 day alone for a 24 hour period, if you maximize Cables volatility.... you can actually gather almost at least 400 pips. That is if you can trade each turn that the price makes ( worthy ones ).

EG

PS. EW Analysis definitely needs the Fibo Tool.
 
 
  • Post #19
  • Quote
  • Mar 9, 2007 11:25am Mar 9, 2007 11:25am
  •  el grande
  • | Joined Nov 2006 | Status: Member | 2,021 Posts
To All those who follow this thread.

Please note that I am still learning EW Analysis. The opinions here are just opinions and are not recommended to be used as basis for your LIVE Trades.

EG
 
 
  • Post #20
  • Quote
  • Mar 9, 2007 5:04pm Mar 9, 2007 5:04pm
  •  AmatPro
  • | Joined Feb 2007 | Status: professional (?) amateur | 91 Posts
A newb question perhaps: it seems Elliot Wave means that when the market goes up (long) you get 5 waves and when the market goes down (short) you get 3 waves.

What I do not understand is how in FX there can be an 'up' or a 'down', since up for one currency of a pair means down for the other and vice versa.
 
 
  • Interactive Trading
  • /
  • Elliott Wave Counting with EG
  • Reply to Thread
    • Page 1 23456 142
    • Page 1 2 142
0 traders viewing now
  • More
Top of Page
  • Facebook
  • Twitter
About FF
  • Mission
  • Products
  • User Guide
  • Media Kit
  • Blog
  • Contact
FF Products
  • Forums
  • Trades
  • Calendar
  • News
  • Market
  • Brokers
  • Trade Explorer
FF Website
  • Homepage
  • Search
  • Members
  • Report a Bug
Follow FF
  • Facebook
  • Twitter

FF Sister Sites:

  • Metals Mine
  • Energy EXCH
  • Crypto Craft

Forex Factory® is a brand of Fair Economy, Inc.

Terms of Service / ©2023