• Home
  • Forums
  • Trades
  • News
  • Calendar
  • Market
  • Brokers
  • Login
  • Join
  • User/Email: Password:
  • 10:05pm
Menu
  • Forums
  • Trades
  • News
  • Calendar
  • Market
  • Brokers
  • Login
  • Join
  • 10:05pm
Sister Sites
  • Metals Mine
  • Energy EXCH
  • Crypto Craft

Options

Bookmark Thread

First Page First Unread Last Page Last Post

Print Thread

Similar Threads

Elliott Wave Counting with EG 2,835 replies

ECN && STP && Scalping && Hedging - Broker Review - Oct 2009 24 replies

Can anyone help me with counting Elliott waves 1 reply

Is there any website show the elliott counting? 8 replies

Elliott Wave Counting DJIA 0 replies

  • Trading Discussion
  • /
  • Reply to Thread
  • Subscribe
  • 19
Attachments: Automatic Elliott Wave Counting & Analysis
Exit Attachments
Tags: Automatic Elliott Wave Counting & Analysis
Cancel

Automatic Elliott Wave Counting & Analysis

  • Post #1
  • Quote
  • First Post: Dec 24, 2018 1:48am Dec 24, 2018 1:48am
  •  noobshow
  • | Joined Aug 2015 | Status: Passer-by | 59 Posts
Hi all,
I would be posting both historical and current Elliott Wave charts of major pairs(fx), stocks and futures here periodically as a reference and to teach or learn how to do better/proper Elliott Wave Counting.

I'm here to learn from those who know better and probably to teach those who would want to learn from my little repository...

For those who might be wondering what is Elliot Wave, please "Search the forum to get full glimpse of what it is and how best to use the signals/labels"

The first images in this thread are an example of what will be posted here(for those who don't know what Elliot Wave is "and don't want to search, yet").

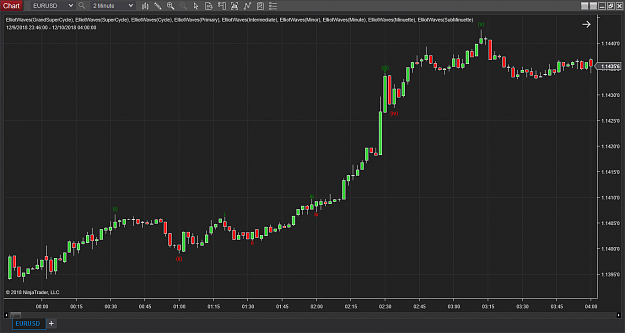
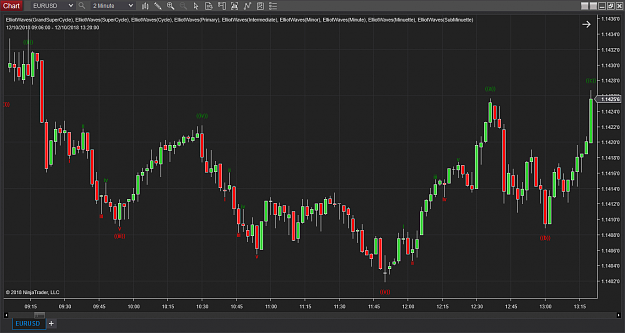
Here is EURUSD(M1) formed on the 12/13/2018(14:09 GMT)
Attached Image (click to enlarge)
Click to Enlarge

Name: Screenshot1.png
Size: 49 KB


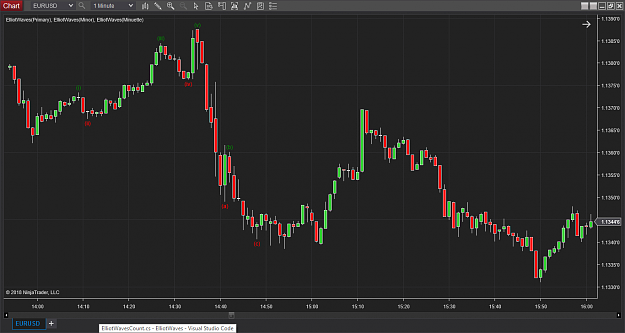
Here is EURUSD(M1) formed on 12/18/2018(10:58 GMT), the C Wave was so long that it almost tear apart the chart
Attached Image (click to enlarge)
Click to Enlarge

Name: Screenshot2.png
Size: 50 KB


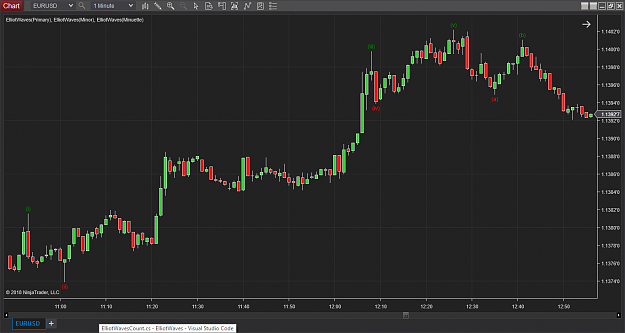
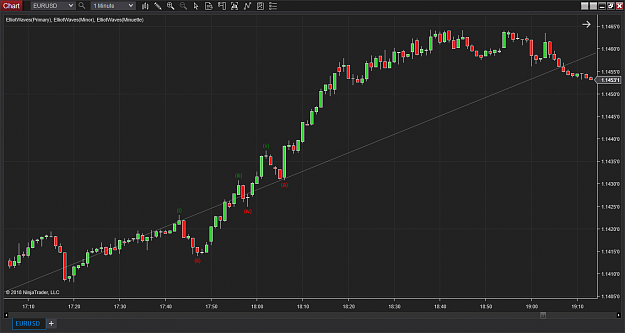
Here is EURUSD(M1) formed on 12/19/2018(14:59 GMT), a trending moment for the abc to be shown in another chart angle
Attached Image (click to enlarge)
Click to Enlarge

Name: Screenshot3.png
Size: 51 KB


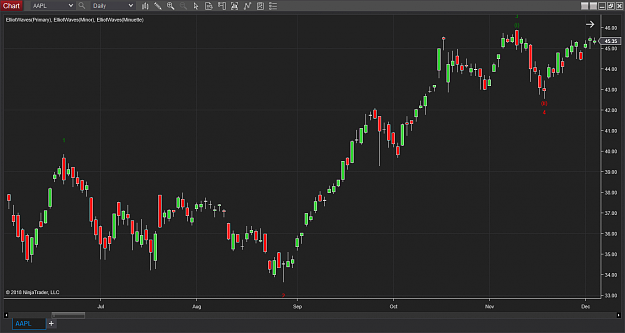
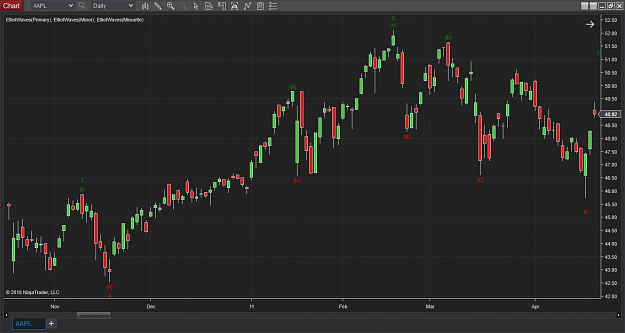
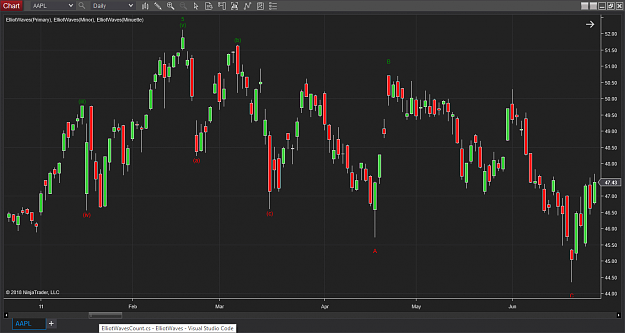
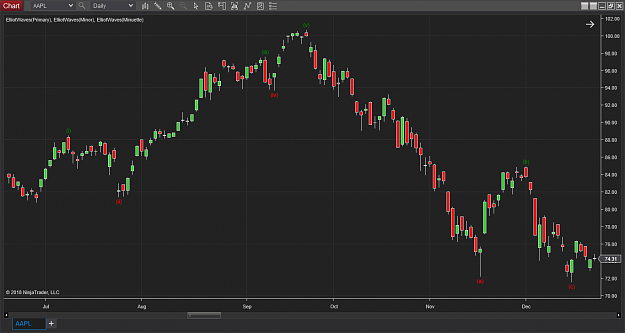
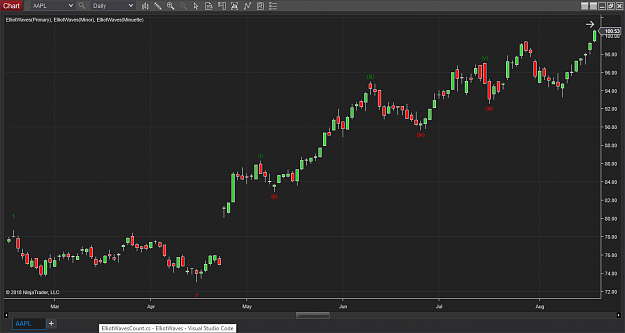
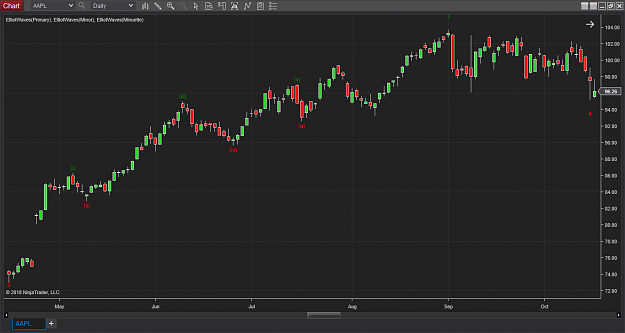
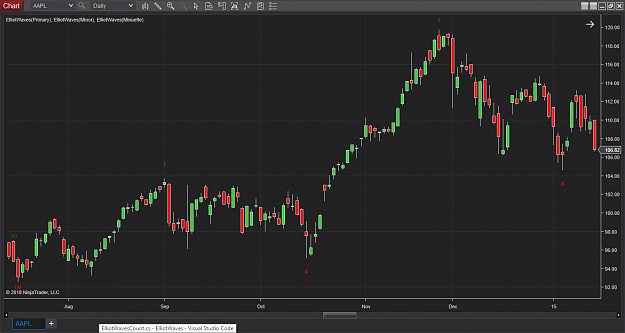
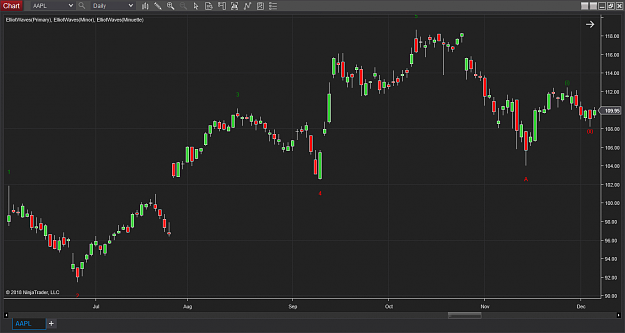
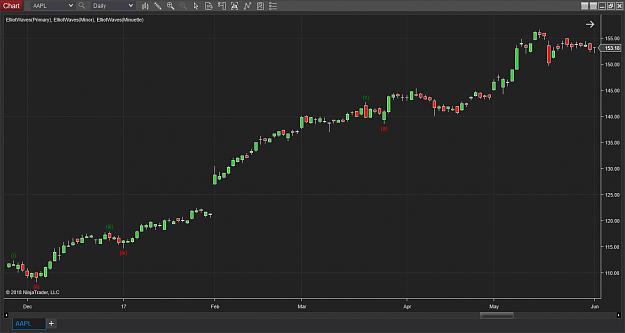
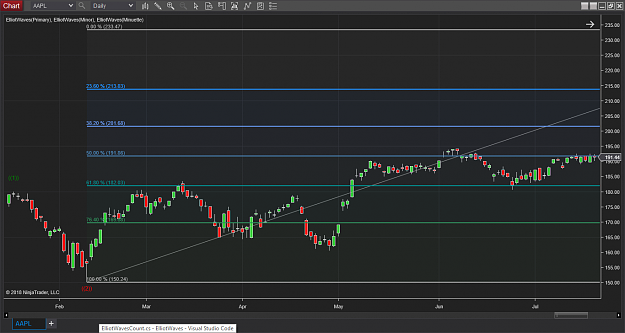
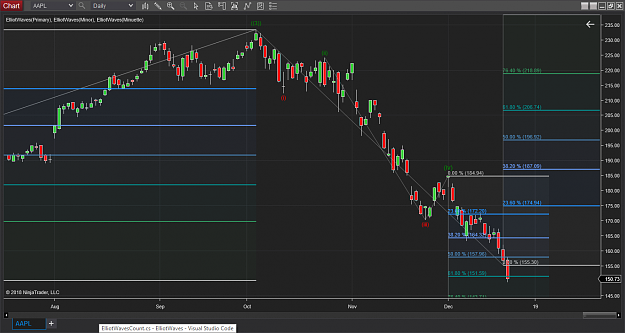
Here is EURUSD(Daily) forming since 3/1/2018, it's on it's move to wave "a"
Attached Image (click to enlarge)
Click to Enlarge

Name: Screenshot5.png
Size: 57 KB

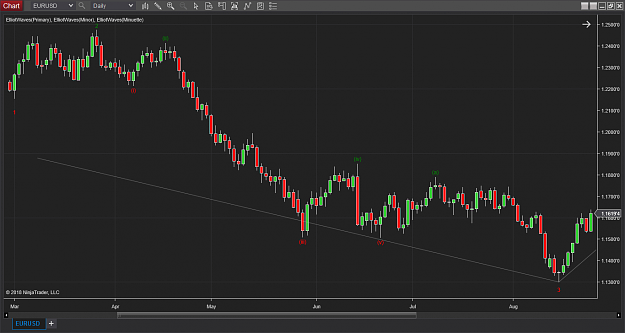
after validating the 5th wave on 11/12/2018
Attached Image (click to enlarge)
Click to Enlarge

Name: Screenshot6.png
Size: 90 KB


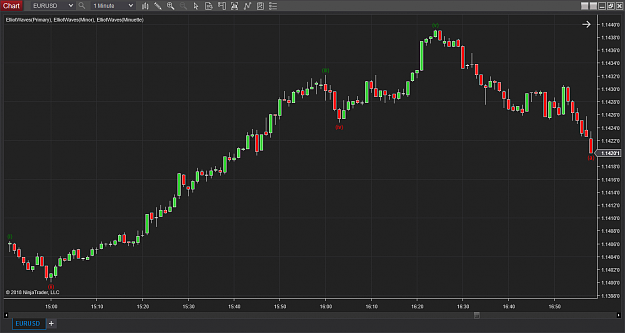
Like everything in trading, even with the highest probability of success, it's meant to fail at one time or the other, even if not up to the success rate %, here is a EURUSD(M1) formed on 12/20/2018(17:23 GMT) that failed after the wave "b" traded past the start of the wave "a" which was meant to be a stoploss .
Attached Image (click to enlarge)
Click to Enlarge

Name: Screenshot4.png
Size: 60 KB


More would come in other currencies, stocks, futures and even commodities at random intervals, i will try keeping everyone posted and once again critics are allowed, but be damn serious about your criticism(not words like xxx's charts are better "I never said mine was the best").

If there's anyone more perfect in Elliot Wave Counting, please post here as well, we never can tell i might have missed some waves back there.

Thanks,
noobshow.

NB: My Charts won't be the best you've ever seen, criticism allowed(even strong one would be taken as a plus to my little knowledge) .
My Waves counting are automatically plotted, though this is a version 1 and more criticism would be taken note of to improve on the Program.
  • Post #2
  • Quote
  • Edited 2:58am Dec 24, 2018 2:33am | Edited 2:58am
  •  noobshow
  • | Joined Aug 2015 | Status: Passer-by | 59 Posts
Here is Historical AAPL(Daily) forming from 6/21/2010

1st-4th Wave (6/21/2010 to 11/17/2010)
Attached Image (click to enlarge)
Click to Enlarge

Name: Screenshot1.png
Size: 45 KB


3rd-"A" Wave (11/9/2010 to 4/18/2011)
Attached Image (click to enlarge)
Click to Enlarge

Name: Screenshot2.png
Size: 51 KB


5th-"C" Wave (2/16/2011 to 6/20/2011)
Attached Image (click to enlarge)
Click to Enlarge

Name: Screenshot3.png
Size: 50 KB
 
 
  • Post #3
  • Quote
  • Dec 24, 2018 2:37am Dec 24, 2018 2:37am
  •  noobshow
  • | Joined Aug 2015 | Status: Passer-by | 59 Posts
Here is Historical AAPL(Daily) formed from 7/10/2012 to 12/17/2012

Attached Image (click to enlarge)
Click to Enlarge

Name: Screenshot1.png
Size: 48 KB
 
 
  • Post #4
  • Quote
  • Dec 24, 2018 2:55am Dec 24, 2018 2:55am
  •  noobshow
  • | Joined Aug 2015 | Status: Passer-by | 59 Posts
Here is Historical AAPL(Daily) forming from 2/18/2014

Here is 1st and 2nd wave
Attached Image (click to enlarge)
Click to Enlarge

Name: Screenshot1.png
Size: 49 KB


Here is 2nd-4th wave (4/16/2014 to 10/15/2014), the mini-wave failed at "b" coz the trend (same trend as the bigger degree wave) was so strong that it (the "b" wave) hit the stoploss set above the wave "a".
Attached Image (click to enlarge)
Click to Enlarge

Name: Screenshot2.png
Size: 47 KB


Here is 3rd-"a" wave (9/2/2014 to 1/6/2015) where the Bigger Wave Cycle failed at "b", the same count where it's 2nd mini-wave failed.
Attached Image (click to enlarge)
Click to Enlarge

Name: Screenshot3.png
Size: 48 KB
 
 
  • Post #5
  • Quote
  • Dec 24, 2018 3:12am Dec 24, 2018 3:12am
  •  noobshow
  • | Joined Aug 2015 | Status: Passer-by | 59 Posts
Here is Historical AAPL(Daily) formed from 6/6/2016

Here is wave 1 to "A" (6/6/2016 to 11/14/2016) which failed at "B" wave after hitting the "A" stoploss
Attached Image (click to enlarge)
Click to Enlarge

Name: Screenshot1.png
Size: 46 KB
 
 
  • Post #6
  • Quote
  • Dec 24, 2018 3:27am Dec 24, 2018 3:27am
  •  noobshow
  • | Joined Aug 2015 | Status: Passer-by | 59 Posts
Here is Historical AAPL(Daily) formed from 11/28/2016

Here is wave (i) to "(a)" (11/28/2016 to 3/27/2017) which failed at "(b)" wave after hitting the "(a)" stoploss at 142.80(on 3/28/2017)
Attached Image (click to enlarge)
Click to Enlarge

Name: Screenshot1.png
Size: 44 KB
 
 
  • Post #7
  • Quote
  • Dec 24, 2018 3:57am Dec 24, 2018 3:57am
  •  T4Trade
  • Joined Sep 2017 | Status: Trend Following,Price Action,Grid | 2,173 Posts
Quoting noobshow
Disliked
Here is Historical AAPL(Daily) formed from 11/28/2016 Here is wave (i) to "(a)" (11/28/2016 to 3/27/2017) which failed at "(b)" wave after hitting the "(a)" stoploss at 142.80(on 3/28/2017) {image}
Ignored
Do you mean your EW couting on this pair started in 2010? who holds the trades for so long? most of us have accounts of few thousand dollars and we can hold trades for few days to weeks.
 
 
  • Post #8
  • Quote
  • Dec 24, 2018 4:03am Dec 24, 2018 4:03am
  •  noobshow
  • | Joined Aug 2015 | Status: Passer-by | 59 Posts
Here is AAPL(Daily) formed from 1/18/2018(January 18th, 2018)

Here is 1st/"((1))" to 2nd"((2))" wave :
Attached Image (click to enlarge)
Click to Enlarge

Name: Screenshot1.png
Size: 66 KB


The 3rd"((3))" wave took 163 days to complete(or form), such a long days uptrend after the 2nd wave corrected (or simply retraced) the 1st wave in a flat formation.
However, failed to move on with the cycle after the 4th"((4))" wave hit the 180.10 high of the 1st"((1))" wave.
Attached Image (click to enlarge)
Click to Enlarge

Name: Screenshot2.png
Size: 82 KB


The Strong downtrend however still continued and will surely continue till the end of year(2018).

NB: This is not a trading advise, it is purely an analysis which are meant to fail or be successful depending on reader's usage and extended approach in verifying it.
 
 
  • Post #9
  • Quote
  • Dec 24, 2018 4:17am Dec 24, 2018 4:17am
  •  noobshow
  • | Joined Aug 2015 | Status: Passer-by | 59 Posts
Quoting T4Trade
Disliked
{quote} Do you mean your EW couting on this pair started in 2010? who holds the trades for so long? most of us have accounts of few thousand dollars and we can hold trades for few days to weeks.
Ignored
lol, that's a higher degree Wave counting and it's just like i said "Historical", i only went back on Daily Chart to get a full run of how Elliot Wave has been working on AAPL(Daily) since some years back .

It's close to end of the year and most things i post for now are random, by the start of next year, i would tend to post from higher to lower degree wave analysis(for many random Instruments/Symbols) that would help scalpers and long term traders make those pips that's risk/reward effective in the long/short run.

Thanks for passing by,
Words and Questions like this are encouraging and would/might change alot in what get posted and to know what's wanted.

Thanks,
noobshow
 
1
  • Post #10
  • Quote
  • Dec 24, 2018 6:37am Dec 24, 2018 6:37am
  •  noobshow
  • | Joined Aug 2015 | Status: Passer-by | 59 Posts
Here is Historical EURUSD(M2) formed from 12/10/2018

Wave 1(i) to 5(v)
Attached Image (click to enlarge)
Click to Enlarge

Name: Screenshot1.png
Size: 51 KB
 
 
  • Post #11
  • Quote
  • Last Post: Dec 24, 2018 6:43am Dec 24, 2018 6:43am
  •  noobshow
  • | Joined Aug 2015 | Status: Passer-by | 59 Posts
Here is Historical EURUSD(M2) formed from 12/10/2018

Here is a Wave ((i)) to ((c)) formed between 12/10/2018(09:06 to 13:20 GMT) following the market Zigzag
Attached Image (click to enlarge)
Click to Enlarge

Name: Screenshot1.png
Size: 59 KB
 
 
  • Trading Discussion
  • /
  • Automatic Elliott Wave Counting & Analysis
  • Reply to Thread
0 traders viewing now
Top of Page
  • Facebook
  • Twitter
About FF
  • Mission
  • Products
  • User Guide
  • Media Kit
  • Blog
  • Contact
FF Products
  • Forums
  • Trades
  • Calendar
  • News
  • Market
  • Brokers
  • Trade Explorer
FF Website
  • Homepage
  • Search
  • Members
  • Report a Bug
Follow FF
  • Facebook
  • Twitter

FF Sister Sites:

  • Metals Mine
  • Energy EXCH
  • Crypto Craft

Forex Factory® is a brand of Fair Economy, Inc.

Terms of Service / ©2023