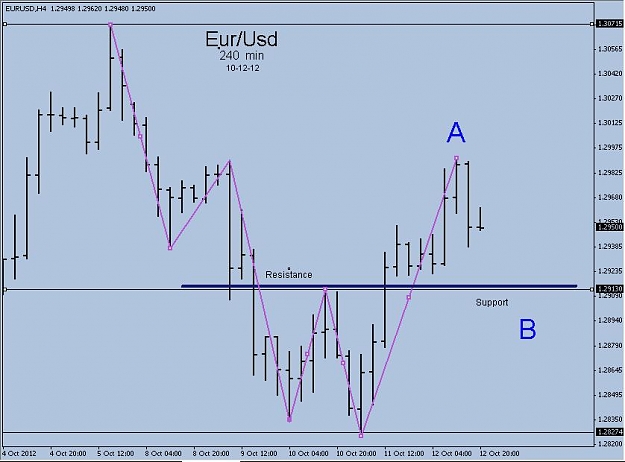
DislikedThis is better for the first chart...
By the way -10 pips yesterday. Short euro dollar now at 1.2972Ignored
Hi Luis,
a quick few words regarding probabilities:
the W-wave is highly unlikely as you have counted it. Statistics show, that in falling double zigzags wave C is minimum around 75% of wave A by price. In the majority of cases it is between 100 and 150% of A
By time, in most cases, it is between 80 and 275%.
So by judging from the statistics the count is highly unlikely.
But I think there are more possibilities to count it as a double zigzag :-)
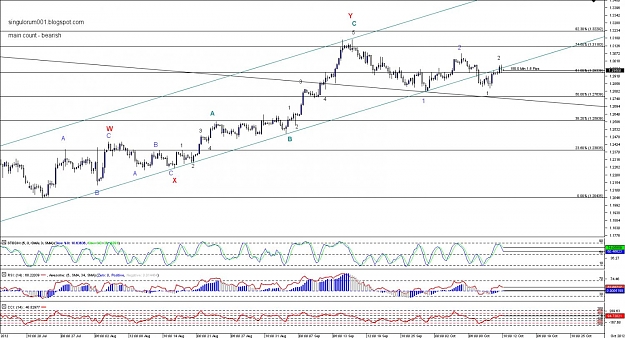
When we look at the internals of this wave W we can see, that is does not offer the best impulsive nature. Nonetheless we can come up with the idea of a leading diagonal (down). Adding to that we have to notice, that price broke out of the base channel which contained the movements from the 204x low.
Right now we are testing this base channel from the lower side. When price can regain it, we surely have a high chance to see new highs. If not.....
Some try to count the whole movement since the top at 3171 as part of a triangle, where we are now in wave D (up) of this triangle.
Due to some good fib relationships/fib retracements I do think, that the highest chance is for a count, where we have seen the top at 3171, and are now in the first part of a larger structure down to below 1.18.
But with the action of the last days I have trouble to find a nice solution.
At this time we can count nearly everything.
So I will watch and see, what the price is doing at the channel line :-)
Attached Image (click to enlarge)