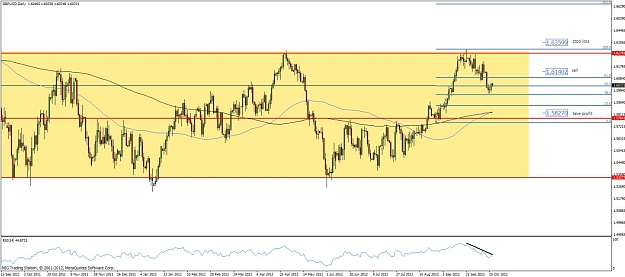
On the Daily chart we see that we are undergoing a downisde correction for the 1.5747-1.6306 wave.
GBP/USD is contained in a large range, from 1.5336 to 1.6276 and it has formed a Double Top formation with the first top at the range's resistance in 29 April and the second top has formed trough September.
This means that furher downside is to be expected.
The price has tested the range's resistance for several days in September, and you can clearly see on the chart that it was rejected there and then it started its drop since the beginning of October.
Even though it has fallen over 270 pips since then, the price has currently found significant support at the Fibo 50.0 level of 1.5747-1.6306 wave.
Even though retracemens to the upside are a definite possibility, it is most probable that the price will continue its advance lower with the RSI respecting its downtrend line on the Daily chart.
Another sound argument for the short setup is that GBP/USD has a high degree of correlation at the moment , as the other majors like EUR/USD,EUR/JPY and USD/JPY to GOLD wich has clearly shown a Triple Top formation on its Daily chart and has started to drop significantly since the beginning of the week, being joined by all the other pairs.
All those pairs are located inside a range and have been rejected at the range's resistance.
Furthermore, our trade setup on the Daily chart provides a safe and sound risk/reward ratio opportunity to short the pair.
Next important support should be encountered near the middle of the range, in proximity of the 1.5784 level wich is near the confluence of the two moving averages, the longer 200 period SMA and the faster (blue) SMA.
This provides us with a correct and realistic longer term target using the Daily chart.
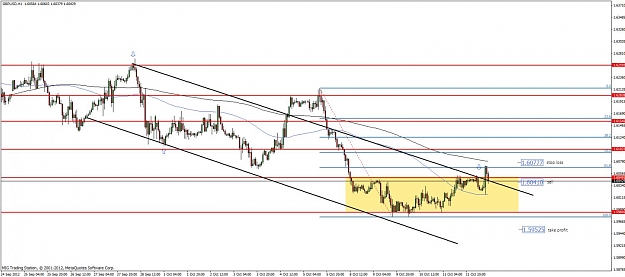
Next, we will take a look in detail at the H1 chart of GBP/USD to locate a good entry position for our short setup.
We see on the H1 chart that we have a downtrend channel wich contained the price's movements since the end of September.
Recently, a range has formed inside the channel, between 1.5984 and 1.6048.
The price has broken out of the channel and range,wich looks more like a false breakout and has been rejected once at the Fibo 61.8 level of the 1.6216-1.5975 wave , wich is best seen on the H4 chart.
Further upside should be limited to 1.6120s but a resume to the downside movement is to be expected.
Sell only after the price goes back into the broken channel/range and closes below 1.6040.
Good Luck
GBP/USD is contained in a large range, from 1.5336 to 1.6276 and it has formed a Double Top formation with the first top at the range's resistance in 29 April and the second top has formed trough September.
This means that furher downside is to be expected.
The price has tested the range's resistance for several days in September, and you can clearly see on the chart that it was rejected there and then it started its drop since the beginning of October.
Even though it has fallen over 270 pips since then, the price has currently found significant support at the Fibo 50.0 level of 1.5747-1.6306 wave.
Even though retracemens to the upside are a definite possibility, it is most probable that the price will continue its advance lower with the RSI respecting its downtrend line on the Daily chart.
Another sound argument for the short setup is that GBP/USD has a high degree of correlation at the moment , as the other majors like EUR/USD,EUR/JPY and USD/JPY to GOLD wich has clearly shown a Triple Top formation on its Daily chart and has started to drop significantly since the beginning of the week, being joined by all the other pairs.
All those pairs are located inside a range and have been rejected at the range's resistance.
Furthermore, our trade setup on the Daily chart provides a safe and sound risk/reward ratio opportunity to short the pair.
Next important support should be encountered near the middle of the range, in proximity of the 1.5784 level wich is near the confluence of the two moving averages, the longer 200 period SMA and the faster (blue) SMA.
This provides us with a correct and realistic longer term target using the Daily chart.
Next, we will take a look in detail at the H1 chart of GBP/USD to locate a good entry position for our short setup.
We see on the H1 chart that we have a downtrend channel wich contained the price's movements since the end of September.
Recently, a range has formed inside the channel, between 1.5984 and 1.6048.
The price has broken out of the channel and range,wich looks more like a false breakout and has been rejected once at the Fibo 61.8 level of the 1.6216-1.5975 wave , wich is best seen on the H4 chart.
Further upside should be limited to 1.6120s but a resume to the downside movement is to be expected.
Sell only after the price goes back into the broken channel/range and closes below 1.6040.
Good Luck
Attached Image(s) (click to enlarge)