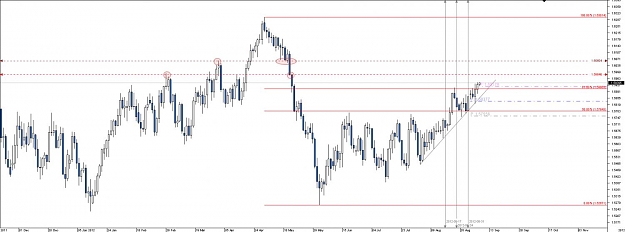
It's interesting to me because it contains mixed signals from what I can see.
An obvious bearish pole
Resistance cloud above.
A wedge pattern with higher lows and lower highs
Also
Hidden bullish divergence on CCI (I think) - with lower candlestick highs but higher CCI highs.
Looking like a possible diamond reversal pattern forming at the last 5 candles (lower wicks).
This is all just interesting stuff I enjoy looking at to fill the time. I don't trade quarterly, I am working off daily charts now, so not really relevant to my trade execution right now.
Come with me if you want to live....