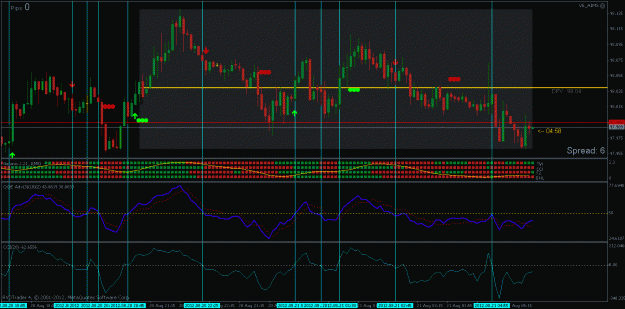
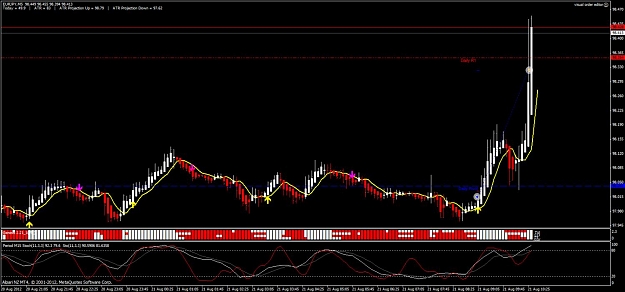
DislikedI mentioned earlier on how I have the ATR indi on my M15 chart so I don't clutter my M5 chart, and Olivia explained how the ATR works. See the pic below.....today's expected ATR is 73 pips....and so far we have covered 71.6 pips.
So to go lower....or higher than todays extremes, I would need a pretty strong signal.
It's just one of things to bear in mind when tradingIgnored
Believe it or not, there is a lot more information hidden inside the basic ATR indicator. In fact, I took the basic calculation for ATR (which is nothing more than an average of the candle's High-Low) and tweaked it through several versions until I came out with an indicator that outputs seven (7) different modes, or signals. So, from the ATR, you can extract at least seven (7) more characteristic, or behavioral outputs that tell you a bit more than just the High-Low average to be expected.
The ATR (my version is called something different) can be a really good Timing Indicator, which is something that most traders have yet to discover. Its value as a Timing Indicator is probably more than its value as a Magnitude Indicator. However, you have to observe it in the right chart time frame, in order to see its true value and worth as a tool for Timing the move of the market (not its direction). It is not a directional indicator by any means.
Gee - maybe I should spend some time on this subject just a bit somewhere on the forum.
Regards,
StealthTechnology