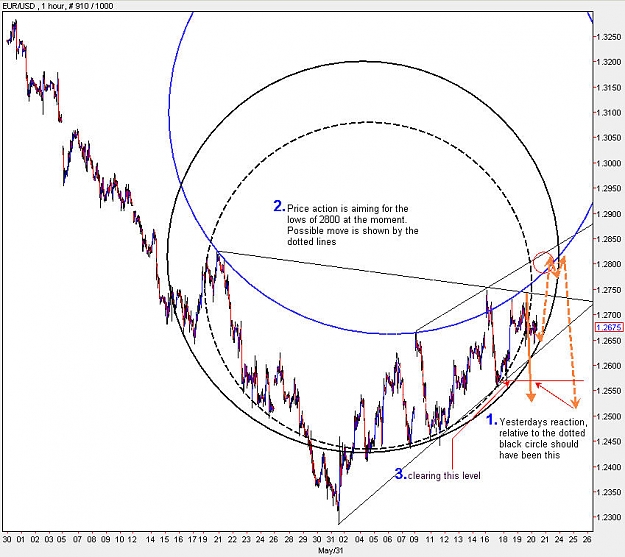
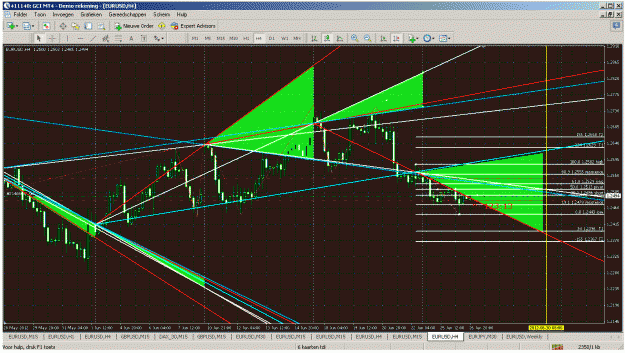
EUR H1
The upward motion on the failed efforts of yesterday is not complete yet. Price action is not showing the necessairly drop that needs to be there to confirm that we are exiting the support of the black circle.
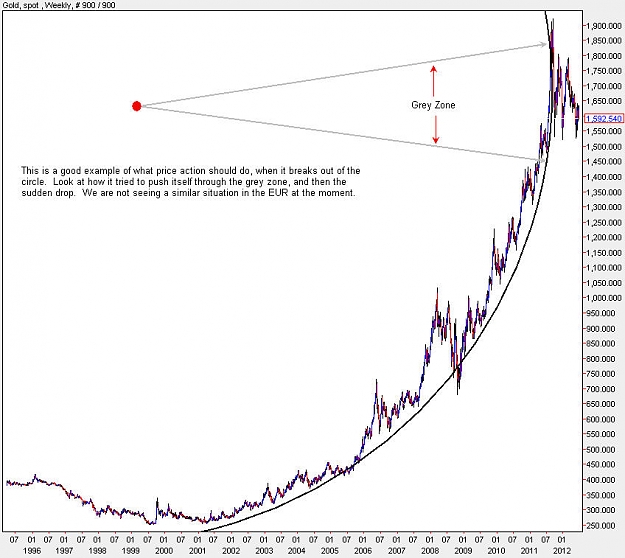
Gold Weekly
I have included the chart for the weekly time frame of Gold, to show how price action reached its maximum stretch within the curvature and the nature of the drop out of the curvature.
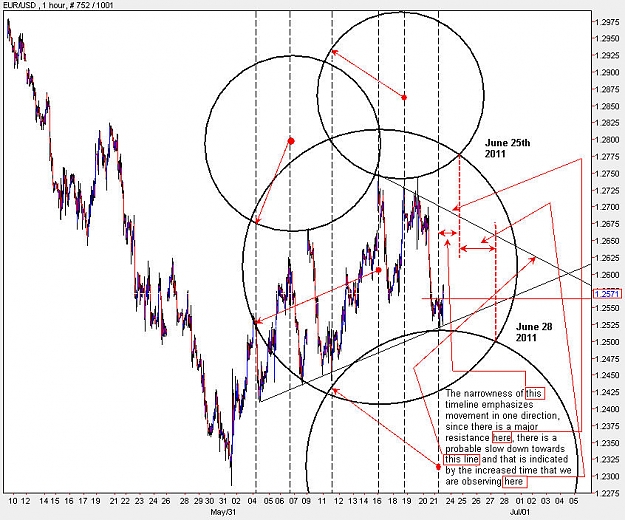
EUR H4
We need to see a similar scenario here. As long as we dont see that we are going upwards. A similar war of prices occured between Feb 17 2012 and Feb 22 2012. I have also included a chart of that time in here to draw attention to a strong possible move upwards.
We do have a curved top in the current scenario, which could imply a turnaround at the moment, but lower time frames are not confirming to this. So the curved top could be a false indication as well.
The upward motion on the failed efforts of yesterday is not complete yet. Price action is not showing the necessairly drop that needs to be there to confirm that we are exiting the support of the black circle.
Gold Weekly
I have included the chart for the weekly time frame of Gold, to show how price action reached its maximum stretch within the curvature and the nature of the drop out of the curvature.
EUR H4
We need to see a similar scenario here. As long as we dont see that we are going upwards. A similar war of prices occured between Feb 17 2012 and Feb 22 2012. I have also included a chart of that time in here to draw attention to a strong possible move upwards.
We do have a curved top in the current scenario, which could imply a turnaround at the moment, but lower time frames are not confirming to this. So the curved top could be a false indication as well.
Attached Image(s) (click to enlarge)