guys. here's my deduction. please correct me if I'm wrong as I'm just starting out.
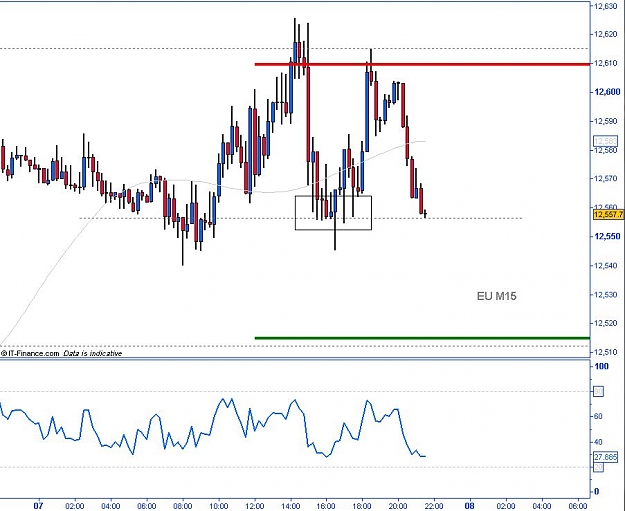
on the 15min and 30min chart, a bearish butterfly was formed when price was tested at 1.2624.
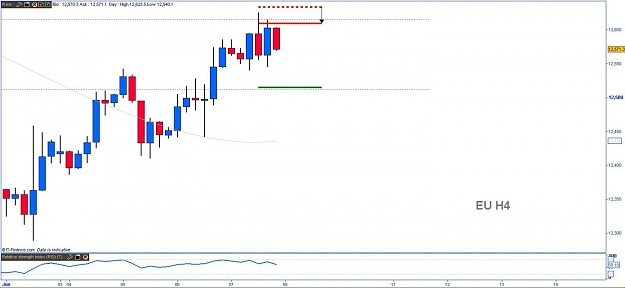
Price tested 1.2624 which was a past daily support which seems to have become resistance. FIBO retracement of 61.8% was also around this level(1.2620).
Price drops and now, it will test 1.2624 again. If it bounces off 1.2624 again,
retracement 'might' be complete and would continue on it's way down for now considering that there are no news within the next few hours. Or it might go down and come back up to test 1.2624 again.
If it breaks 1.2624, it might go up to 1.2667 and come down or 1.2822.
on the 15min and 30min chart, a bearish butterfly was formed when price was tested at 1.2624.
Price tested 1.2624 which was a past daily support which seems to have become resistance. FIBO retracement of 61.8% was also around this level(1.2620).
Price drops and now, it will test 1.2624 again. If it bounces off 1.2624 again,
retracement 'might' be complete and would continue on it's way down for now considering that there are no news within the next few hours. Or it might go down and come back up to test 1.2624 again.
If it breaks 1.2624, it might go up to 1.2667 and come down or 1.2822.