• Home
  • Forums
  • Trades
  • News
  • Calendar
  • Market
  • Brokers
  • Login
  • Join
  • User/Email: Password:
  • 4:46am
Menu
  • Forums
  • Trades
  • News
  • Calendar
  • Market
  • Brokers
  • Login
  • Join
  • 4:46am
Sister Sites
  • Metals Mine
  • Energy EXCH
  • Crypto Craft

Options

Bookmark Thread

First Page First Unread Last Page Last Post

Print Thread

Similar Threads

How to program the std indicator to take to take price from other indicator windows 0 replies

Indicator of the indicator 11 replies

Adding an indicator to an indicator 10 replies

Indicator/Trendline Pips indicator 2 replies

add indicator to an Indicator 4 replies

  • Platform Tech
  • /
  • Reply to Thread
  • Subscribe
  • 12
Attachments: TickInsider Indicator
Exit Attachments
Tags: TickInsider Indicator
Cancel

TickInsider Indicator

  • Last Post
  •  
  • Page 1 2
  • Page 1 2
  •  
  • Post #1
  • Quote
  • First Post: Edited May 19, 2012 10:59am May 18, 2012 10:24am | Edited May 19, 2012 10:59am
  •  recidiviste
  • | Commercial Member | Joined May 2009 | 777 Posts
first of all want to tell you all my idea comes from post from

ROOICOL

http://www.forexfactory.com/rooicol

is the master of ticks & broker selection.....


specially that Thread

http://www.forexfactory.com/showthread.php?t=359473

i will explain my idea for indicator here under....

(if any kind coder around :WELCOME)
BROKENGLISH
  • Post #2
  • Quote
  • May 18, 2012 10:34am May 18, 2012 10:34am
  •  recidiviste
  • | Commercial Member | Joined May 2009 | 777 Posts
display data on histogram format /shape

bar > zero line

all based on ticks data and apply a formula to those data

*/duration of each ticks in seconds
*/variation of the bid side of the currency from 1 tick to the other
*/spread of currency on each tick


(the problem now is i need my special formula and the 3 indicators are not synchronised toghether so hard to SEE whats going on .....)


1/ duration in time (seconds) that each tick last. ( this data is always positive 0 to + x )

tick = 1.49 seconds

format we use x.xx


2/Variation of the bid side from one tick to the other . ( this data can be + & - )

data is positive if bid of tick 2 > bid of tick 1

bid tick 1 1.291000 & bid tick 2 1.291110

bid + 0.000110pips

format we use + 1.10

bid can go up or down on each tick

s0 this data can be - 1.10

(on the pic here under it doesnt display by + or - data display only variation)


3/ spread

simple spread of the currency during that tick

0.000060

format we use 0.60

same pic as above but see on right hand side in the white box very standard stuff.

formula simple


idea is mix all this

first i take time data * by the change in bid (both very important )

1/you can see on chart some jump in time = compression/distribution

2/jump variation in bid & sign of bid + or - = aggressive bid or offer

&

3/spread of product to balance power of 1 & 2

so idea of formula

if

( 1 * 2 ) >0 then [ (1*2) - 3 ]

so

( 1.49 * 1.10 ) - 0.60 = + 1.039

+ 1.639 - 0.60 = + 1.039 (green bar )

or

if bid went down

if (1*2)< 0 then [ (1*2)+3]

( 1.49 * - 1.10 ) + 0.60 = - 1.039 (red bar)


this is tick by tick output & histogram with red or green bar

and need alert level > x or < y on this histogram data output

this is tick by tick !

&

need another one just doing the sum of those data bar to match the time frame we have on the chart

example 1 minute chart will display 1 minute histogram based on above ticks formula

if 1 minute = 12 ticks ( changing all time depending on duration of ticks ...)

( 1 tick green +0.45 ) + ( 2 tick red -0.20 ).... = total will make a bar of x color x power that match the time frame of the chart .....

---------------------------------------------------------
thanks to comment improve idea ....!

----------------------------------------------------------

http://www.forexfactory.com/attachme...1&d=1336815509
BROKENGLISH
 
 
  • Post #3
  • Quote
  • May 19, 2012 7:30am May 19, 2012 7:30am
  •  recidiviste
  • | Commercial Member | Joined May 2009 | 777 Posts
really think there is some value inside that idea

pls comment ...

regards
BROKENGLISH
 
 
  • Post #4
  • Quote
  • May 21, 2012 5:41am May 21, 2012 5:41am
  •  recidiviste
  • | Commercial Member | Joined May 2009 | 777 Posts
hello frds

can a coder kindly consider having a look into idea/coding...

thanks in advance
BROKENGLISH
 
 
  • Post #5
  • Quote
  • May 22, 2012 9:26pm May 22, 2012 9:26pm
  •  blueboy
  • | Joined Dec 2011 | Status: Junior Member | 1 Post
im not a coder,
but i do really like your idea!
i think it could be a great indicator for scalper


  • Post #6
  • Quote
  • May 23, 2012 6:23am May 23, 2012 6:23am
  •  recidiviste
  • | Commercial Member | Joined May 2009 | 777 Posts
Quoting blueboy
Disliked
im not a coder,
but i do really like your idea!
i think it could be a great indicator for scalper

Ignored
--------------------

thing issue is there is a lot of code request in platform tech .......
BROKENGLISH
 
 
  • Post #7
  • Quote
  • May 23, 2012 7:32am May 23, 2012 7:32am
  •  rooicol
  • Joined Jan 2010 | Status: Trader | 494 Posts
Generally, volatile price action comes it two forms: Liquid, and Illiquid.

Volatile liquid price action usually has a low spread, a fast tick rate, and a relatively large tick size though not too large, the actual movement in price is made up by the high tick rate from the multiple participants.

Volatile and illiquid price action usually has a high spread, a lower tick rate, and a very large tick size.

By multiplying tick rate by tick size you will lose the ability to discern whether the market is liquid (high tick rate * large tick size) or illiquid (low tick rate * even larger tick size) as the product will be similarly large relative to normal trading. Likewise for trying to factor in the spread. When the output is just a single number, there are different ways in which that number could have been reached. Essentially you are just condensing the data into a considerable less meaningful single number. In my opinion you would be better off just have the three moving average values just printed on your main trading screen, it gives you more information.

However the problem with that (and condensing the data into a single number displayed in a histogram) is that it is visual. It is something you have to look at. If you scalp and trade a fast paced strategy, you will be wanting to focus on price action itself when you have exposure and not other derivatives like this. This is why I prefer to get this data from another sensory input: Sound. With sound you can get all the info you need about tick rate, tick size, and tick direction, whilst watching price action.
 
 
  • Post #8
  • Quote
  • May 23, 2012 8:01am May 23, 2012 8:01am
  •  recidiviste
  • | Commercial Member | Joined May 2009 | 777 Posts
Quoting rooicol
Disliked
Generally, volatile price action comes it two forms: Liquid, and Illiquid.

Volatile liquid price action usually has a low spread, a fast tick rate, and a relatively large tick size though not too large, the actual movement in price is made up by the high tick rate from the multiple participants.

Volatile and illiquid price action usually has a high spread, a lower tick rate, and a very large tick size.

By multiplying tick rate by tick size you will lose the ability to discern whether the market is liquid (high tick rate * large tick size)...
Ignored
-------------------------------------------

i see your point

i tryed by putting only

tick rate (duration ) & ticks spread (variation of bid side )

on the chart and i see often that when

tick rate go up a lot just after tick spread decrease a lot
& then market move a lot in pips....

i cannot sort out the exact rules because the indicator are not synchronised
will try to put a pic asap

see you
BROKENGLISH
 
 
  • Post #9
  • Quote
  • May 23, 2012 8:05am May 23, 2012 8:05am
  •  recidiviste
  • | Commercial Member | Joined May 2009 | 777 Posts
will comment on next
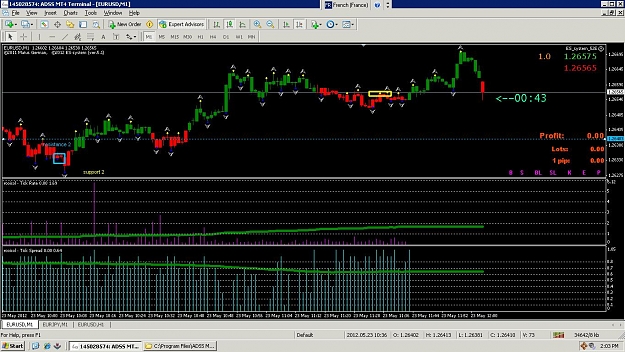
Attached Image (click to enlarge)
Click to Enlarge

Name: ticks1.JPG
Size: 209 KB
BROKENGLISH
 
 
  • Post #10
  • Quote
  • May 23, 2012 8:07am May 23, 2012 8:07am
  •  recidiviste
  • | Commercial Member | Joined May 2009 | 777 Posts
on left hand side u can see

tick rate shoot up
tick spread deceasing down to zero

&

on chart see market down > 15 pips

problem i have is not synchronised
&
dont know cannot see sign of tick spread +/-
BROKENGLISH
 
 
  • Post #11
  • Quote
  • May 23, 2012 8:21am May 23, 2012 8:21am
  •  recidiviste
  • | Commercial Member | Joined May 2009 | 777 Posts
shoot up & go to zero

candle down 8/12 ticks
Attached Image (click to enlarge)
Click to Enlarge

Name: t2.JPG
Size: 213 KB
BROKENGLISH
 
 
  • Post #12
  • Quote
  • May 23, 2012 8:28am May 23, 2012 8:28am
  •  rooicol
  • Joined Jan 2010 | Status: Trader | 494 Posts
Quoting recidiviste
Disliked
on left hand side u can see

tick rate shoot up...
Ignored
High histogram value means low tick rate, low histogram value means a high rate. Rate = 1/Duration.

If you get an indicator that shows the average spread of a candle, then you can compare the mean spread during the period of a particular candle and the volume of that candle divided by the chart period in seconds.
 
 
  • Post #13
  • Quote
  • May 23, 2012 8:29am May 23, 2012 8:29am
  •  rooicol
  • Joined Jan 2010 | Status: Trader | 494 Posts
Quoting recidiviste
Disliked
shoot up & go to zero

candle down 8/12 ticks
Ignored
again, as you can see, the rate actually goes down when tick duration increases. You would see this more clearly if you turned the moving average period down much lower.
 
 
  • Post #14
  • Quote
  • May 23, 2012 9:34am May 23, 2012 9:34am
  •  recidiviste
  • | Commercial Member | Joined May 2009 | 777 Posts
Quoting rooicol
Disliked
again, as you can see, the rate actually goes down when tick duration increases. You would see this more clearly if you turned the moving average period down much lower.
Ignored
thanks for your kind comment & time
BROKENGLISH
 
 
  • Post #15
  • Quote
  • May 24, 2012 4:31am May 24, 2012 4:31am
  •  recidiviste
  • | Commercial Member | Joined May 2009 | 777 Posts
tick rate = tick duration in time

formula 1/ x seconds

if bar big = very fast tick correct ?????

tick size = variation of bid side

this data can be + & - correct ???

think the best is to mix those 2 to get interesting indicator
BROKENGLISH
 
 
  • Post #16
  • Quote
  • May 24, 2012 11:33am May 24, 2012 11:33am
  •  recidiviste
  • | Commercial Member | Joined May 2009 | 777 Posts
think the good mix is

tick rate * by tick size

tick size is + or -

red green histogram...
BROKENGLISH
 
 
  • Post #17
  • Quote
  • May 25, 2012 1:51am May 25, 2012 1:51am
  •  recidiviste
  • | Commercial Member | Joined May 2009 | 777 Posts


need coder help me with this simple idea

thanks

BROKENGLISH
 
 
  • Post #18
  • Quote
  • May 25, 2012 3:10am May 25, 2012 3:10am
  •  recidiviste
  • | Commercial Member | Joined May 2009 | 777 Posts
tick rate = duration in seconds

formula = 1/ time ok keep the same

tick size = variation in pips of bid side

this data can be + or - we use that system ( now its abs in example )

simple

histogram

tick rate ( 1/secs) * tick size (+or-)
BROKENGLISH
 
 
  • Post #19
  • Quote
  • May 27, 2012 5:02am May 27, 2012 5:02am
  •  pipNvestment
  • | Commercial Member | Joined May 2012 | 63 Posts
Quoting recidiviste
Disliked
tick rate = duration in seconds

formula = 1/ time ok keep the same

tick size = variation in pips of bid side

this data can be + or - we use that system ( now its abs in example )

simple

histogram

tick rate ( 1/secs) * tick size (+or-)
Ignored
before the coding begins. what is the overall goal with this data.

are you trying to get the best price ( lowest spread at a fill)
or using this data to determine where the market may go next?

This information is useful but only if you understand what this data means and how you will apply to your strategy.

Basically we have three concepts here
1.) Duration of Tick ( seconds elapsed from last tick - )
2.) Spread variation at each tick ( did spread increase or decrease)
3.) Size of tick ( how many pips( fractional ) did the last tick move)

also do you have the source code of the indicators on your chart. if so > share!
 
 
  • Post #20
  • Quote
  • May 27, 2012 5:21am May 27, 2012 5:21am
  •  recidiviste
  • | Commercial Member | Joined May 2009 | 777 Posts
if

1/time = data 1

data 1 is always + & > 0 & from 0 to 50 +

2/ bid side variation = data 2

data 2 = + & - & decimals depend of currency & broker

must think it over

data 2 = + 0.000010 €/$

data2 = - 0.02 AUD/$

need find a good formula

want keep info of both sides

if e/usd ecn

(1/time)*(data2*100 000 )

then output is ok i think will test more next week
BROKENGLISH
 
 
  • Platform Tech
  • /
  • TickInsider Indicator
  • Reply to Thread
    • Page 1 2
    • Page 1 2
0 traders viewing now
  • More
Top of Page
  • Facebook
  • Twitter
About FF
  • Mission
  • Products
  • User Guide
  • Media Kit
  • Blog
  • Contact
FF Products
  • Forums
  • Trades
  • Calendar
  • News
  • Market
  • Brokers
  • Trade Explorer
FF Website
  • Homepage
  • Search
  • Members
  • Report a Bug
Follow FF
  • Facebook
  • Twitter

FF Sister Sites:

  • Metals Mine
  • Energy EXCH
  • Crypto Craft

Forex Factory® is a brand of Fair Economy, Inc.

Terms of Service / ©2023