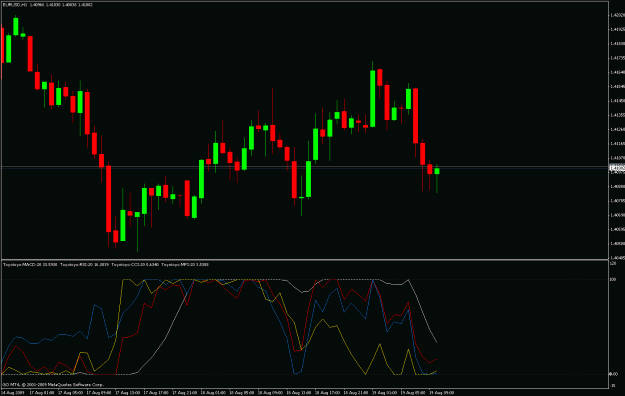
Hi guys, do you know of an indicator that will compute and plot chart of an indicator?
the formula is this:
[TODAY'S READING - LOWEST READING(say in the last 20days)]
--------------------------------------------------------------------------------------- X 100
[HIGHEST READING(say in the last 20days) - LOWEST READING(say in the last 20days)]
variables are:
var1: any indicator e.g. MACD, CCI, RSI, ADX, MFI etc
var2: last X days
any ideas guys?
thanks for any help.
