In a previous post:
http://www.forexfactory.com/showthre...75#post5623075
the probability of a turn was discussed that would happen around on May 4th for the wave that had started from 2997 on April 16th.
Almost close to April 4th,
After the drop from 3280 towards 3100, there was a strong bounce towards 3180 again. Although 180 pips did went quite fast, but there seems to be quite a bit of hesitation in showing desire to go further down. In another word the speed of the upward motion is slightly diminishing.
When a correction takes such a long time, as it has been with this particular wave (April 16 / 2997 onwards) then a stronger than normal thrust is required. Such thrusts are reminicent of the thrust that developed 3378 on April 2nd
When a lack of further desire to go downwards is being observed, chances are high that the thrust down was only a setup for further upward motion.
Looking at the time slot on the H8 chart a time slot close to May 11 pops up for the next phase of any possible action.
Because again it looks like we have been caught in a false start of the drop that has started from 3280 on May 1st, I can only conclude that this drop is a setup to go long until around May 11
But long to where?
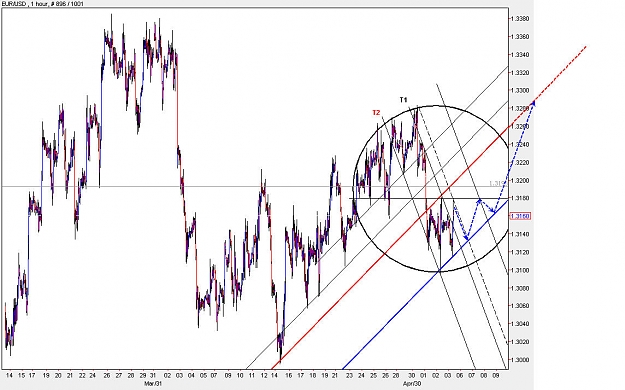
The prime target is a break of the upper trendline in blue.
However
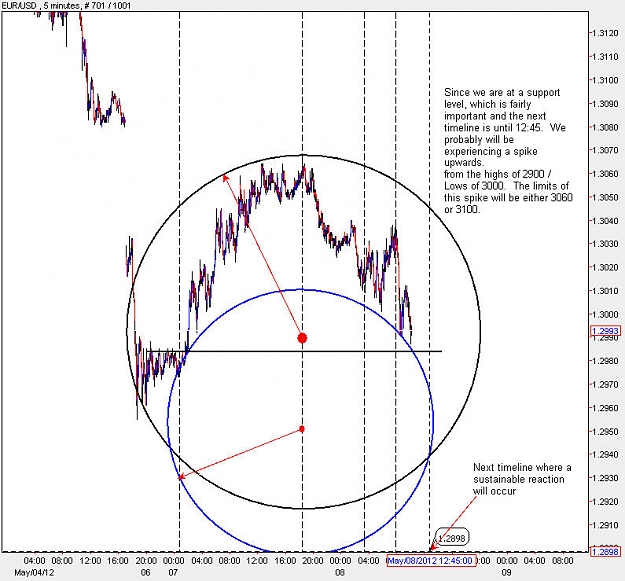
Given the discussion we had earlier about the weekly time frame, this break will be a false break, that means the high of 3280 will get broken, and we will probably have 3310-3330 as a high by sometime middle of next week, then after that the true downtrend towards 2900 will begin.
If you notice on the H8 chart on February 7th 2012 we also had a similar thrust developing toward 2970 level.
My prediction for tomorrow is a possible dip to 3120 and then a rise upwards, or we will rise right from 3150, but downward direction is starting to look a little bleak.
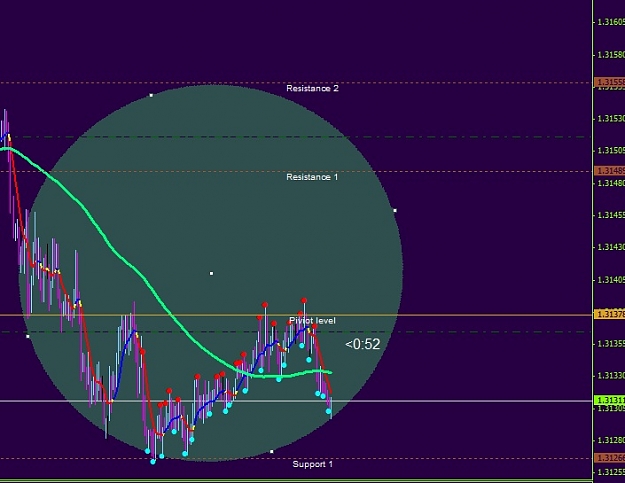
Today we faced a important resistance at 3180, but the bounce off that resistance was not favorable.
In a downtrend scenario we need 3150 to be broken decisively and fast, this is also another sign that we had a false start for a downtrend.
http://www.forexfactory.com/showthre...75#post5623075
the probability of a turn was discussed that would happen around on May 4th for the wave that had started from 2997 on April 16th.
Almost close to April 4th,
After the drop from 3280 towards 3100, there was a strong bounce towards 3180 again. Although 180 pips did went quite fast, but there seems to be quite a bit of hesitation in showing desire to go further down. In another word the speed of the upward motion is slightly diminishing.
When a correction takes such a long time, as it has been with this particular wave (April 16 / 2997 onwards) then a stronger than normal thrust is required. Such thrusts are reminicent of the thrust that developed 3378 on April 2nd
When a lack of further desire to go downwards is being observed, chances are high that the thrust down was only a setup for further upward motion.
Looking at the time slot on the H8 chart a time slot close to May 11 pops up for the next phase of any possible action.
Because again it looks like we have been caught in a false start of the drop that has started from 3280 on May 1st, I can only conclude that this drop is a setup to go long until around May 11
But long to where?
The prime target is a break of the upper trendline in blue.
However
Given the discussion we had earlier about the weekly time frame, this break will be a false break, that means the high of 3280 will get broken, and we will probably have 3310-3330 as a high by sometime middle of next week, then after that the true downtrend towards 2900 will begin.
If you notice on the H8 chart on February 7th 2012 we also had a similar thrust developing toward 2970 level.
My prediction for tomorrow is a possible dip to 3120 and then a rise upwards, or we will rise right from 3150, but downward direction is starting to look a little bleak.
Today we faced a important resistance at 3180, but the bounce off that resistance was not favorable.
In a downtrend scenario we need 3150 to be broken decisively and fast, this is also another sign that we had a false start for a downtrend.
Attached Image (click to enlarge)