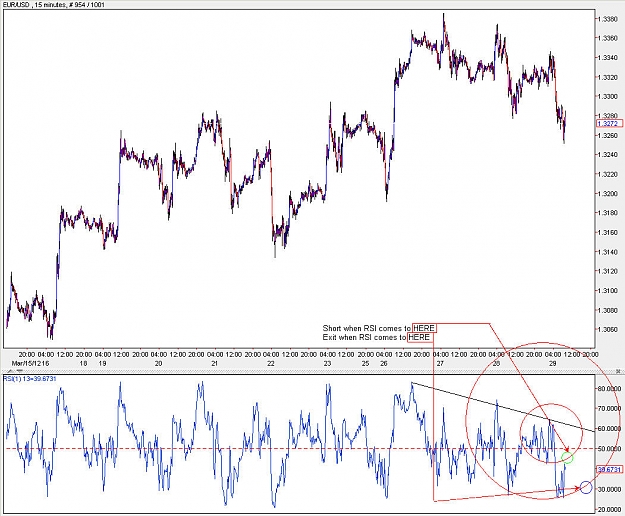
The situation still remains a sell at anywhere in between 3330-3370 region after 15 hours of passage since the last post.
Energy circle in the mentioned post will slowly show its strength, and push down
The situation still remains a sell at anywhere in between 3330-3370 region after 15 hours of passage since the last post.
Energy circle in the mentioned post will slowly show its strength, and push down
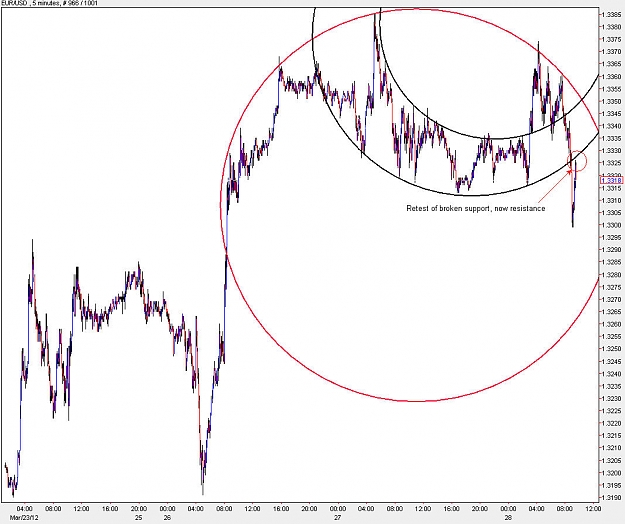
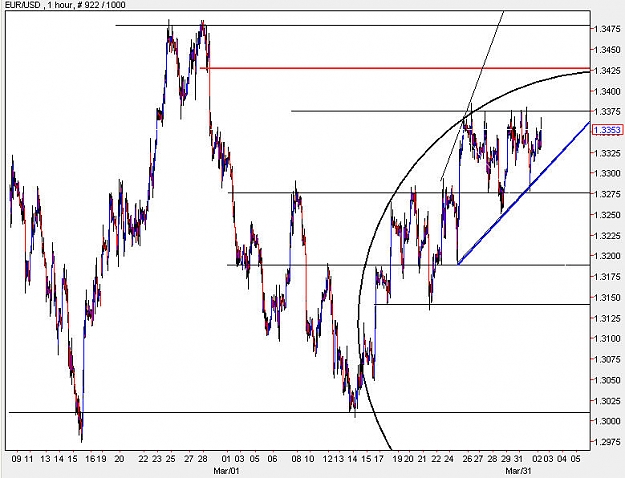
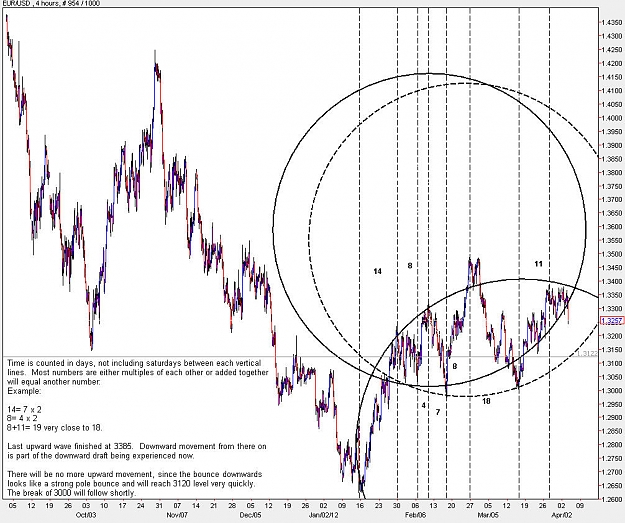
Giving this pair one day of activity since Friday, the conclusion is this, that if it cannot sustain itself above the red line and the pole of the black circle, within the next 6-12 hours, then a pole bounce off the black circle will occur downwards, that will be very hard and fast. This pair is not in a good trading position right now and given the fact that the only way to go to 3600 is to sustain itself above 3425-3450, the safest option is to put pending order for a sell below the blue line and pending order for a buy above the red line. In between these 2 territories its a danger zone, that one does not want to be in.
Myself, right now prefer pending orders for a sell below the blue line, and monitoring that entry as the market gets closer and closer to trigger point on that blue line.
Giving this pair one day of activity since Friday, the conclusion is this, that if it cannot sustain itself above the red line and the pole of the black circle, within the next 6-12 hours, then a pole bounce off the black circle will occur downwards, that will be very hard and fast. This pair is not in a good trading position right now and given the fact that the only way to go to 3600 is to sustain itself above 3425-3450, the safest option is to put pending order for a sell below the blue line and pending order for a buy above the red line. In...
Giving this pair one day of activity since Friday, the conclusion is this, that if it cannot sustain itself above the red line and the pole of the black circle, within the next 6-12 hours, then a pole bounce off the black circle will occur downwards, that will be very hard and fast. This pair is not in a good trading position right now and given the fact that the only way to go to 3600 is to sustain itself above 3425-3450, the safest option is to put pending order for a sell below the blue line and pending order for a buy above the red line. In...
Ignored
========================
Good morning Kambooj,
Brilliant or what? Trust you made a good few pips on the short?
Thank you again for sharing your expertise with us.
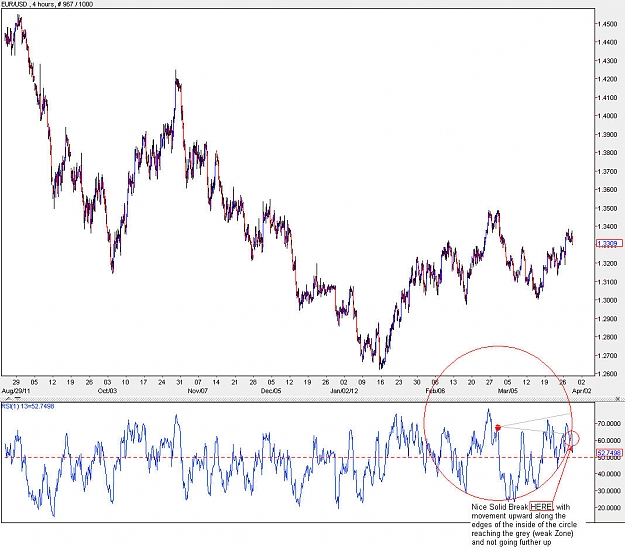
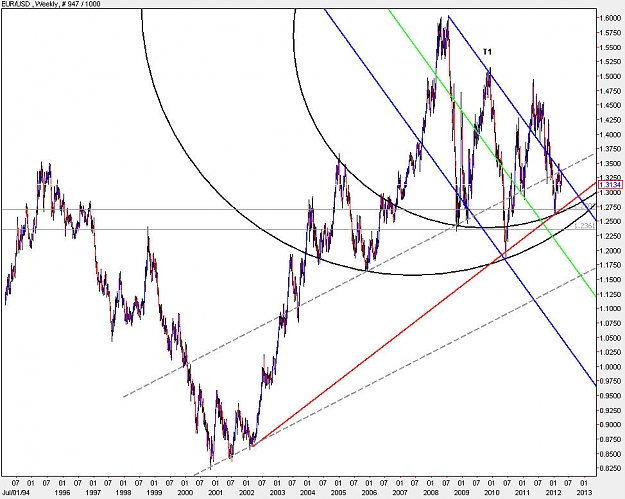
The probability that the T1 trendline will be broken at this time is slim, simply because the rebound that started from 3340 zone yesterday needs to find a strong base to break the T1 trendline. The first strong base is at 2700-2750, if that level wont do it, then it would be 2350 zone, and if that level breaks too, we will be going straight down to the 1700 zone.
On the weekly chart we have a red straight trendline, which there is a lot of opinion on it that price will rebound off that line and go straight to 3700-4000 level, unfortunately what will happen is that a slight rebound will take place that could be bound again by the T1 line, around the 3200 zone.
The reason for saying a "Slight rebound will happen" is that if one pays attention to the dotted grey line, we can see that it was highly respected by the upward motion that started from 2630 around mid january. The 2350-2360 area which falls half way between the 2 dotted grey lines and on the lower black circle is a better place for price action to make a decision on going upwards.
Given the fact that we have at least 450 pips more downward to travel to our first support level, the 3000 level should soon be reached and breached.
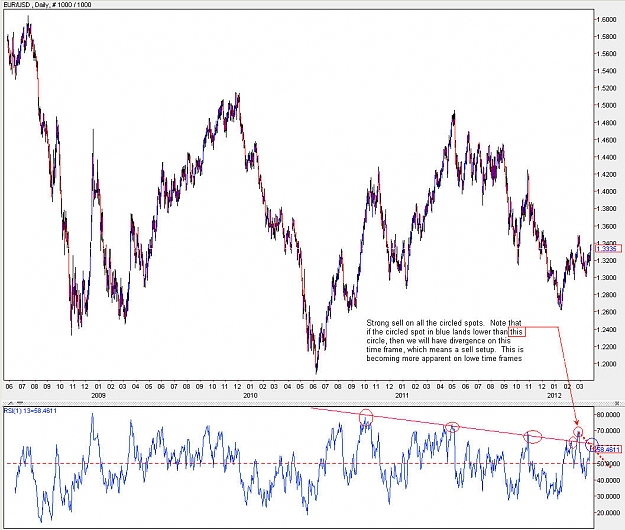
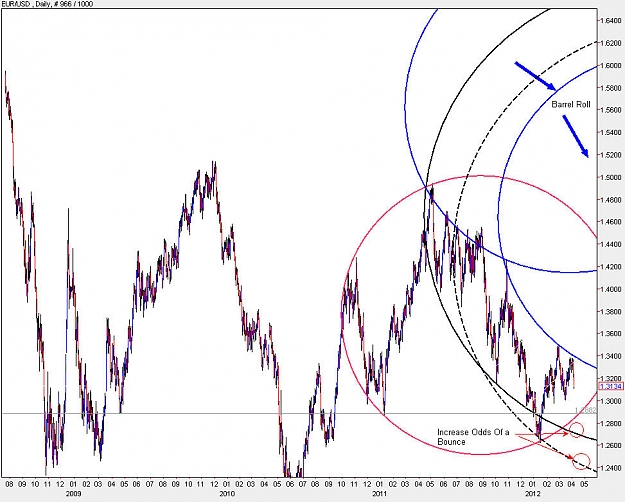
Daily
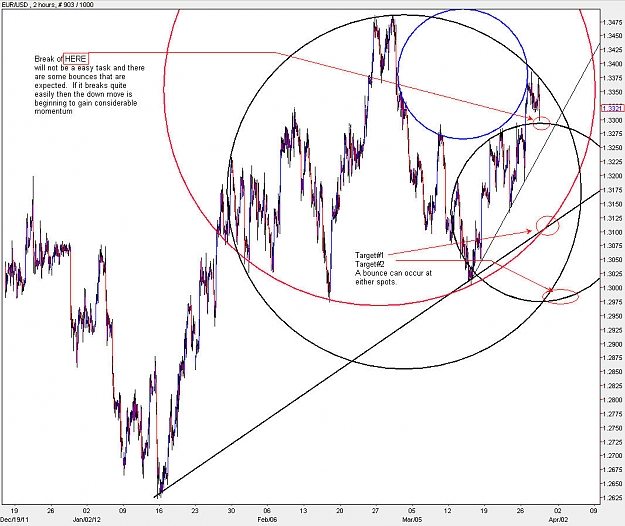
On this time frame we can see the start of a barrel role taking effect, as shown by the blue arrows. The inside perimeter of the red circle will be a weak spot which will not sustain itself very much, however chances of one bounce happening is relatively high. A stronger bounce upwards will most probably be at the inside of either the solid or dotted black circle.
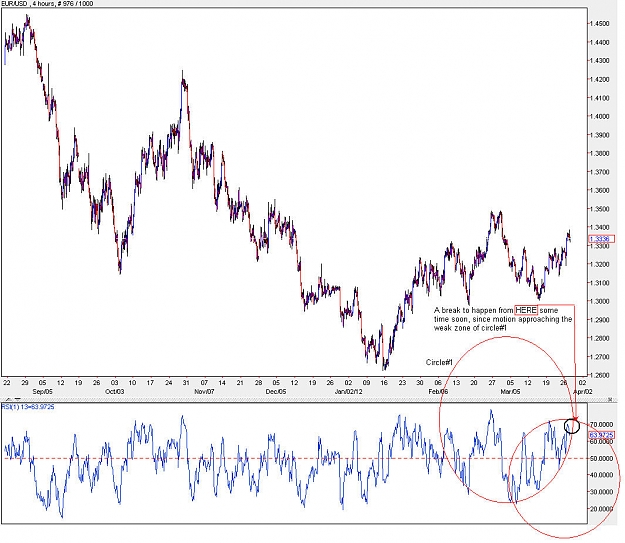
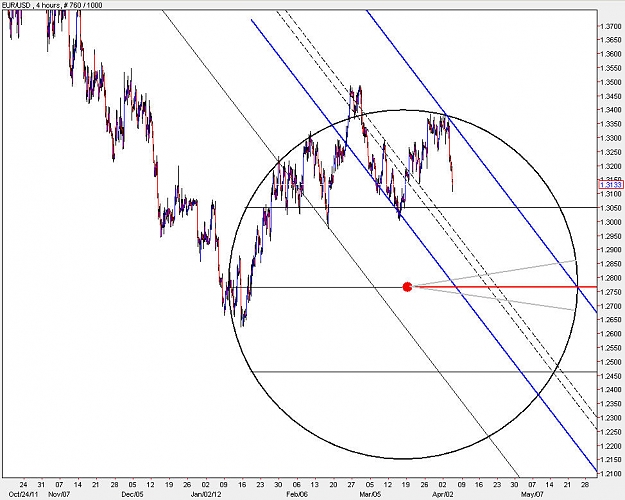
H4
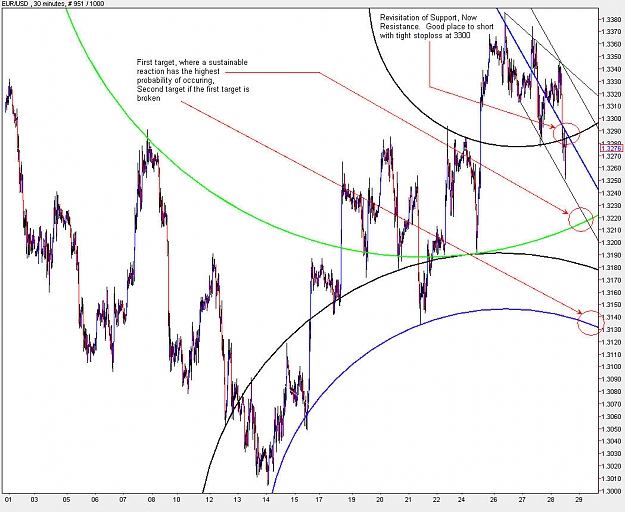
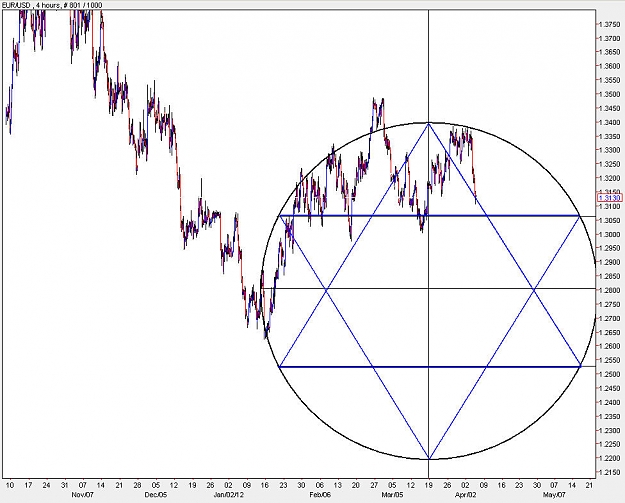
The primary lines of motion on this time frame are the blue lines. The black circle is experiencing a pole bounce from its north pole. Reason for this is that a good authentic pole bounce will quickly travel 20%-30% of the diameter of the circle, and it has already travelled close to 20%.
Dividing the circle into 4 equal parts we get our relative support levels on this time frame. The first support level is at 3050, but given the straight thrust of the bounce from 3340 zone, this level will not hold firm for a bounce upwards.
Instead a higher probability of happening is that we will hit one of the dotted grey lines first, and then visit the 3050 zone which will become a resistance zone. Also note that the dotted grey lines fall very close to the "Grey Zone / Agitation Zone" of the circle. Movement will be highly agitated as it comes closer to the center of the circle around 2750, which is also 88.6% retracement of the move from 2630.
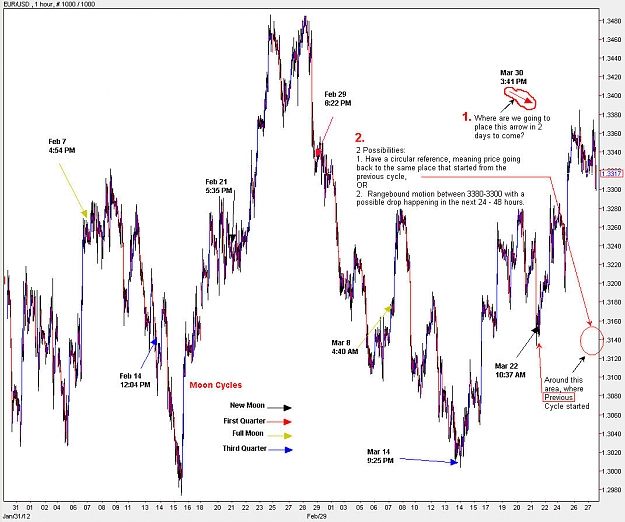
The smaller time frames are not informitive enough on what level to go short. The best odds for a place to go short is anywhere between April 6 and 7 where the Full Moon comes out (April 6 at 3:20 PM New York Time). So any high that is reached during that time will have increased odds of being a good place for a shorting opportunity.
The probability that the T1 trendline will be broken at this time is slim, simply because the rebound that started from 3340 zone yesterday needs to find a strong base to break the T1 trendline. The first strong base is at 2700-2750, if that level wont do it, then it would be 2350 zone, and if that level breaks too, we will be going straight down to the 1700 zone.
On the weekly chart we have a red straight trendline, which there is a lot of opinion on it that price will rebound off that line and go straight...
Ignored
Your strategy is coming togather nicely...now that you can see the patterns and assign the behavior of the circles, trendlines, and channels to past behavior / likely outcomes....spot on dude!
For those who have not heard of "Star Of David" resistance/support lines, is taking a circle and dividing it into 4 parts, then connecting the vertecies as shown.
The blue lines will become your future support / resistance points and the whole structure resembles a 6 pointed star
For those who have not heard of "Star Of David" resistance/support lines, is taking a circle and dividing it into 4 parts, then connecting the vertecies as shown.
The blue lines will become your future support / resistance points and the whole structure resembles a 6 pointed star
Ignored
nicely done dont forget the intersections as divisions of time
For those who have not heard of "Star Of David" resistance/support lines, is taking a circle and dividing it into 4 parts, then connecting the vertecies as shown.
The blue lines will become your future support / resistance points and the whole structure resembles a 6 pointed star
Ignored
If this chart for long term then need to correct it
It must have the zone 1.40 , I don't know how but 1.40 must visit in future
Run to my work
Not all of the sections of the Star will be visited. Its always portions of the star.
For now I have 1.2700 being reached before 1.4000.
Current retracement from 1.3035 will only be a rewind to break 3000 and go below that.
For now extreme bearishness is still holding till 2700-2750, after that 3600 and 4000 are quite possible.
will be releasing charts later in the day. I am just waiting to see how the pair reacts to 3080. If we get a rebound off that level to break 3000 and end up at 2950, then tomorrow will be a up move. If not then 3110 will be visited and after that more downmove.
Nothing is 100% confirmed, just watching the manner in which the rebound is happening from 3035 this morning.