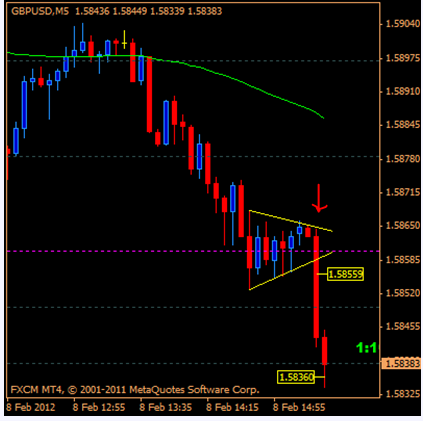
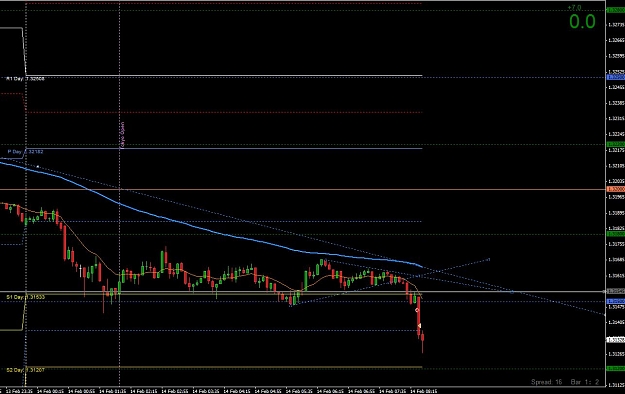
• Home
  • Forums
  • Trades
  • News
  • Calendar
  • Market
  • Brokers
  • Login
  • Join
  • User/Email: Password:
  • 2:50am
Menu
  • Forums
  • Trades
  • News
  • Calendar
  • Market
  • Brokers
  • Login
  • Join
  • 2:50am
Sister Sites
  • Metals Mine
  • Energy EXCH
  • Crypto Craft

Options

Bookmark Thread

First Page First Unread Last Page Last Post

Print Thread

Similar Threads

Adr, psych levels, demand & supply trading 14 replies

Standard Pivots and Fibonnaci Pivots? 9 replies

EUR/USD 5min - Trendlines and Pivots 379 replies

Important psych levels 1 reply

Too many drawn Trendlines all same look: how to draw Trendlines with different look? 2 replies

  • Trading Systems
  • /
  • Reply to Thread
  • Subscribe
  • 5,394
Attachments: Psych Levels, Pivots, and Trendlines - Resurrected
Exit Attachments

Psych Levels, Pivots, and Trendlines - Resurrected

  • Last Post
  •  
  • 1 398399Page 400401402 623
  • 1 Page 400 623
  •  
  • Post #7,981
  • Quote
  • Feb 8, 2012 7:14am Feb 8, 2012 7:14am
  •  david4u
  • | Joined Jan 2008 | Status: Member | 511 Posts
Thanks master


Quoting eyevoltage
Disliked
Just look at the consolidation along the quarterly-point line, and all those long upper shadows, signifying lots of bearish pressure! It paid off with a strong momentum drop to the next quarterly-point down!

I might continue to post the occasional chart in the hope that others might contribute, but it really does look likely that this thread is dead.

Ignored
 
 
  • Post #7,982
  • Quote
  • Feb 8, 2012 7:37am Feb 8, 2012 7:37am
  •  hsalsa
  • | Joined Mar 2007 | Status: Member | 25 Posts
Hi, eyevoltage, please can share me this template with indicators?

Thanks in advance...

God bless you!


Quoting eyevoltage
Disliked
Here's the chart......
Ignored
 
 
  • Post #7,983
  • Quote
  • Feb 8, 2012 8:33am Feb 8, 2012 8:33am
  •  Forex007
  • | Joined Aug 2007 | Status: I keep my eyes open | 1,108 Posts
Quoting eyevoltage
Disliked
it really does look likely that this thread is dead.

Ignored
Threads - like many other things in life - seem to have a life(cycle) of their own. (On a non-related note, for example, there are persistent rumours that Facebook is losing popularity with its core user base... Oh, well.) Some fade away because people lose faith in the method, others - for no (apparent) reason. I think this thread has undergone several morphing transformations since it was created, and - considering the "theme" of the thread, few people can see the true (practical) value of some of the charts posted here.

You've done a great job here, EV, as did Islander and several other key contributors. I guess the thread's educational potential reached its limit, posts became somewhat repetitive for those who seek "hot stuff" and the crowd left, seeking greener ("hotter") pasture. C'est la vie!

P.S. How about starting your own (pattern/formation based) thread, EV?..
One Chart is Worth Ten Thousand Words.
 
 
  • Post #7,984
  • Quote
  • Feb 8, 2012 9:38am Feb 8, 2012 9:38am
  •  eyevoltage
  • Joined Sep 2006 | Status: Son of this Sceptred Isle. | 3,635 Posts
A consolidation on a mid-point line/MA confluence, with a couple of spinning tops showing indecision, before price finally moved down. Entry and exit as shown.
Attached Image
 
 
  • Post #7,985
  • Quote
  • Feb 8, 2012 9:44am Feb 8, 2012 9:44am
  •  Forex007
  • | Joined Aug 2007 | Status: I keep my eyes open | 1,108 Posts
Quoting eyevoltage
Disliked
A consolidation on a mid-point line/MA confluence, with a couple of spinning tops showing indecision, before price finally moved down. Entry and exit as shown.
Ignored
Great trade, EV! That consolidation formed a nice triangle.
One Chart is Worth Ten Thousand Words.
 
 
  • Post #7,986
  • Quote
  • Feb 8, 2012 9:46am Feb 8, 2012 9:46am
  •  eyevoltage
  • Joined Sep 2006 | Status: Son of this Sceptred Isle. | 3,635 Posts
Quoting hsalsa
Disliked
Hi, eyevoltage, please can share me this template with indicators?

Thanks in advance...

God bless you!
Ignored
Hi halsa.
You really don't need a template for this chart. The pivot point indicator (FXI) is in the attachments at the top. The green lines are quarterly-point lines and I added them manually. However, I'm using SDX-TZ pivots (also in the attachments) now as they have quarterly-points as a built-in option.
 
 
  • Post #7,987
  • Quote
  • Feb 8, 2012 9:53am Feb 8, 2012 9:53am
  •  eyevoltage
  • Joined Sep 2006 | Status: Son of this Sceptred Isle. | 3,635 Posts
Quoting Forex007
Disliked
Great trade, EV! That consolidation formed a nice triangle.
Ignored
Thanks, 007. To be honest, I hadn't looked for a pattern of any sort there, mate. It was the confluence-bound consolidation that attracted me, especially the indecision of the spinning-tops.

I agree with your comments in your earlier post. Maybe the thread has lived out its usefulness, and a new thread with a new slant perhaps, will sort of refresh things a bit? I'll have to have a bit of a think about that!
Cheers.
 
 
  • Post #7,988
  • Quote
  • Feb 8, 2012 10:34am Feb 8, 2012 10:34am
  •  eyevoltage
  • Joined Sep 2006 | Status: Son of this Sceptred Isle. | 3,635 Posts
Switching to the 5m Cable chart, I saw this sideways wedge pattern forming along the Main Pivot line. Entry and exit as shown, and as I type, the bears are showing me that I got out too early perhaps!

Edit...........Yep, MUCH too early!!
Attached Image
 
 
  • Post #7,989
  • Quote
  • Feb 8, 2012 10:41am Feb 8, 2012 10:41am
  •  Vantage
  • Joined Mar 2007 | Status: Member | 7,195 Posts
Hey EV

Nice trades as usual. Who gives a stuff if others post or not, just keep 'em coming. Its good old common sense stuff and if others are chasing the flavour of the month good luck to them.
 
 
  • Post #7,990
  • Quote
  • Feb 8, 2012 10:59am Feb 8, 2012 10:59am
  •  eyevoltage
  • Joined Sep 2006 | Status: Son of this Sceptred Isle. | 3,635 Posts
Quoting Vantage
Disliked
Hey EV

Nice trades as usual. Who gives a stuff if others post or not, just keep 'em coming. Its good old common sense stuff and if others are chasing the flavour of the month good luck to them.
Ignored
Thanks for that, V. "Good old common sense stuff". You're right, brother, that's exactly what it is, but as you say, the "flavour of the month" seems to be what a lot of people want. Your method is sound and profitable, as is this one, but I guess people will always be on the hunt for something "better"!
If it works and it makes a profit why bother with anything else?

Hope you and the good lady are keeping well, V.
 
 
  • Post #7,991
  • Quote
  • Feb 12, 2012 10:45pm Feb 12, 2012 10:45pm
  •  pedross
  • | Joined May 2010 | Status: Member | 276 Posts
Hi EV, been reading this thread and your contributions with much interest after being discouraged with lag-ridden indicators. Working with PA and consolidation areas around pivots makes a lot of sense to me. Looking at your cable example from the other day (and many many other examples of course), I'm curious to know where you place your stop.

Is it where I've marked, above the high of the trade candle or do you use a 1:1 risk reward stop? Eg. 20 pip target 20 pip stop (naturally let momentum guide the TP).

The examples you have provided are excellent EV, would you mind if I posted a few of my own in the near future for confirmation?

Cheers

Pete

Attached Image
 
 
  • Post #7,992
  • Quote
  • Feb 13, 2012 2:38am Feb 13, 2012 2:38am
  •  pedross
  • | Joined May 2010 | Status: Member | 276 Posts
Mid-pivot trade.

Took this break of the trendline after a bounce off the 96EMA. Then waited briefly for more momentum past the 13EMA. TP at around 12 pips at previous high, but price did continue beyond R1!

Pete

Attached Image (click to enlarge)
Click to Enlarge

Name: Capture.JPG
Size: 126 KB
 
 
  • Post #7,993
  • Quote
  • Feb 13, 2012 3:56am Feb 13, 2012 3:56am
  •  eyevoltage
  • Joined Sep 2006 | Status: Son of this Sceptred Isle. | 3,635 Posts
Quoting pedross
Disliked
Hi EV, been reading this thread and your contributions with much interest after being discouraged with lag-ridden indicators. Working with PA and consolidation areas around pivots makes a lot of sense to me. Looking at your cable example from the other day (and many many other examples of course), I'm curious to know where you place your stop.

Is it where I've marked, above the high of the trade candle or do you use a 1:1 risk reward stop? Eg. 20 pip target 20 pip stop (naturally let momentum guide the TP).

The examples you have provided are...
Ignored
Hello Pete and good to meet you.

My SL on that particular trade was set just above the little blue spinning-top, two candles back from the actual momentum candle. I usually set the SL at around 1:1. I very rarely vary from that.

As for your enquiry regarding posting charts.......post away, brother!! All are welcome, believe me!!
 
 
  • Post #7,994
  • Quote
  • Feb 13, 2012 4:20am Feb 13, 2012 4:20am
  •  eyevoltage
  • Joined Sep 2006 | Status: Son of this Sceptred Isle. | 3,635 Posts
Quoting pedross
Disliked
Mid-pivot trade.

Took this break of the trendline after a bounce off the 96EMA. Then waited briefly for more momentum past the 13EMA. TP at around 12 pips at previous high, but price did continue beyond R1!

Pete

Attachment 897007
Ignored
Nice trade, Pete, with good use of the TL and MA.
 
 
  • Post #7,995
  • Quote
  • Feb 14, 2012 1:47am Feb 14, 2012 1:47am
  •  pedross
  • | Joined May 2010 | Status: Member | 276 Posts
Thanks EV.

Another trade, this time 30 mins before FO. After TL break, I waited until PP S1 and major support from 10th of Feb was broken, and last but not least the 50 psych line was violated. Major confluence to say the least!

Bailed at 7 pips near the PP mid-point due to the sometimes erratic behaviour of price before FO.
Should I have stayed put for S2? Time will tell...

Attached Image (click to enlarge)
Click to Enlarge

Name: Capture.JPG
Size: 121 KB
 
 
  • Post #7,996
  • Quote
  • Feb 14, 2012 6:38am Feb 14, 2012 6:38am
  •  eyevoltage
  • Joined Sep 2006 | Status: Son of this Sceptred Isle. | 3,635 Posts
Quoting pedross
Disliked
Thanks EV.

Another trade, this time 30 mins before FO. After TL break, I waited until PP S1 and major support from 10th of Feb was broken, and last but not least the 50 psych line was violated. Major confluence to say the least!

Bailed at 7 pips near the PP mid-point due to the sometimes erratic behaviour of price before FO.
Should I have stayed put for S2? Time will tell...

Attachment 897778
Ignored
Yes, a major confluence, brother. Just weighed it up on my chart and price continued down and hit the quarterly-point right to the pip at 1.3126. However, I understand why you bailed. Was that a symmetrical triangle you traded the breakout from?
 
 
  • Post #7,997
  • Quote
  • Feb 14, 2012 6:44am Feb 14, 2012 6:44am
  •  eyevoltage
  • Joined Sep 2006 | Status: Son of this Sceptred Isle. | 3,635 Posts
Potential breakout from a falling wedge. TWT.
 
 
  • Post #7,998
  • Quote
  • Feb 15, 2012 1:14am Feb 15, 2012 1:14am
  •  pedross
  • | Joined May 2010 | Status: Member | 276 Posts
Quoting eyevoltage
Disliked
Yes, a major confluence, brother. Just weighed it up on my chart and price continued down and hit the quarterly-point right to the pip at 1.3126. However, I understand why you bailed. Was that a symmetrical triangle you traded the breakout from?
Ignored
Got a few questions regarding the numbers 2-5 on the chart EV if you could be so kind to pass comment!

1.Yes, a sym triangle

2. Flag pattern. I didn't take the short on the breakout as I was still wary about that triple confluence above and a possible retest.

3. Flag pattern which was widening and had passed through the triple consolidation passed on a short breakout on fear of a reversal, which did occur later!

4,5. Would you have taken longs on the descending flags here EV. They were on the psych level 3200 or don't you trade these areas any more (perhaps instead for profit targets depending on momentum?)

6. Would have been a definite short for me, if I was awake! An excellent text book rising wedge.

Pete

Attached Image (click to enlarge)
Click to Enlarge

Name: Capture1.JPG
Size: 143 KB
 
 
  • Post #7,999
  • Quote
  • Feb 15, 2012 4:52am Feb 15, 2012 4:52am
  •  eyevoltage
  • Joined Sep 2006 | Status: Son of this Sceptred Isle. | 3,635 Posts
Quoting pedross
Disliked
Got a few questions regarding the numbers 2-5 on the chart EV if you could be so kind to pass comment!

1.Yes, a sym triangle

2. Flag pattern. I didn't take the short on the breakout as I was still wary about that triple confluence above and a possible retest.

3. Flag pattern which was widening and had passed through the triple consolidation passed on a short breakout on fear of a reversal, which did occur later!

4,5. Would you have taken longs on the descending flags here EV. They were on the psych level 3200 or don't you trade these areas any...
Ignored
I wouldn't have taken those flags, Pete. Some might have, but to me, price had already peaked and was on its way down. Number 4 crossed down over the psych-line, but then price tested for resistance and was rejected. It tested again at number 5, but was again rejected and you'll notice that a doji formed right on the psych-line followed by price sinking again. 3200 looked at that time to be impenetrable, so a bullish movement definitely didn't seem to be on the cards. However, after the 5 "flag", you'll notice that price did move up a little and formed a BEARISH flag, giving a strong indication that price was definitely on its way down again.
Hope all that's clear, Pete.
 
 
  • Post #8,000
  • Quote
  • Feb 15, 2012 7:14am Feb 15, 2012 7:14am
  •  eyevoltage
  • Joined Sep 2006 | Status: Son of this Sceptred Isle. | 3,635 Posts
This stemmed from an evening-star type doji candle just above the quarterly-point. Entry as price crossed the quarterly point and exit after the drop just under the Main pivot line.
Attached Image
 
 
  • Trading Systems
  • /
  • Psych Levels, Pivots, and Trendlines - Resurrected
  • Reply to Thread
    • 1 398399Page 400401402 623
    • 1 Page 400 623
0 traders viewing now
  • More
Top of Page
  • Facebook
  • Twitter
About FF
  • Mission
  • Products
  • User Guide
  • Media Kit
  • Blog
  • Contact
FF Products
  • Forums
  • Trades
  • Calendar
  • News
  • Market
  • Brokers
  • Trade Explorer
FF Website
  • Homepage
  • Search
  • Members
  • Report a Bug
Follow FF
  • Facebook
  • Twitter

FF Sister Sites:

  • Metals Mine
  • Energy EXCH
  • Crypto Craft

Forex Factory® is a brand of Fair Economy, Inc.

Terms of Service / ©2022