This thread is not introducing a new concept but intends to build a community of traders helping each other spot opportunities which can be easily observed by following simple rules. Hence, the essence of this thread is to spot opportunities and alert other traders here of those opportunities using the criteria already explicitly mentioned in the title.
If you are not a long-term trader and 20 to 50 pips per trade are good enough for you then this might make sense. For those who do not have time for over-analysis and complex trading systems this will also make sense. If you like to feel comfortable with some level of certainty that your trade will yield profit or, worse case scenario, you exit at break even or little loss, then this will also make sense.
THREAD RULES
1. The golden rule here is to stick to the described system here only so that we can keep it simple.
2. No insults or indecent language here.
Motto: Buy low; sell high
But how do you know when price is high enough for you to sell, or low enough to buy? This has always been the argument. Well, this brings us back to the title of the thread: ADR, Psychological levels, Demand and Supply.
1. Average Daily Range (ADR): As an example, the EURUSD has an ADR of 70 - 100 pips (min to max) on a daily basis. Other pairs also have theirs.
2. Psychological levels: These are known levels where price usually reacts to the opposite. Price levels ending with 00 or 50. Example: 1.1200, 113.00, 1.1450, etc. I prefer price points ending with 00 as they seem to be stronger.
3. Demand and Supply levels: These are strong levels where price has been seen to strongly bounce price away in the opposite direction. They can be easily identified on the charts as supportive or resistant areas.I prefer horizontal levels. The more times that area bounces price the stronger it becomes.
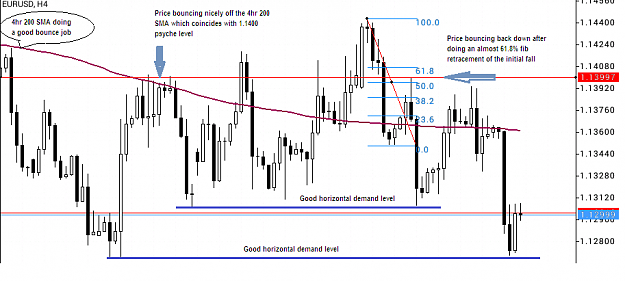
a. In addition to number 3 above, I have noticed that price often respects the 200 SMA on the 4hr timeframe and also respects the 50 SMA on the daily timeframe. I'm not an expert with MAs but these are observations that can be incorporated.
b. The .618% fib retracement also happens to also squeeze out some pips.
TRADE RULES
1. When your pair of choice gets stretched to its ADR (min -max) [the closer to the max, the better] enter a counter move trade for some retracement pips. It could be 10pips, 20 or more. I feel comfortable each time I do this knowing that the daily range is exhausted because price would rather retrace some rather than continue in its previous direction.
NB: Take extra care doing this when moves are caused by news. I generally avoid GBP pairs due to Brexit issues. I don't even touch them with a long pole for now.
2. Take a counter trade for some bounce pips when price approaches a strong 00 or 50 psychological level. This is better when this level has not been tested too recently. The beauty of this is that many times when price even manages to breach this level by a couple of pips it usually comes back at least 10 to 20 pips below/above it. I hardly use the 50 levels. The 00 levels are best.
NB: Make sure this level has not been used or breached too recently. The newer the level the better.
3. Take a counter move trade when price approaches horizontal 'demand/supply' level. I only use levels from 4hrs upwards to yearly levels. The higher the time frame, the stronger the level.
4. For those interested in moving averages, bounces also often occur when price gets to the 4hr 200 SMA or daily 50 SMA. You can also take counter trend trades from these moving averages.
5. The 61.8% fib. Price often reacts when it retraces 61.8% of a move. It's usually easy to join in on a trend using this method.
Finally, when two or more of these criteria combine then the more certain the trade result. For example, imagine the ADR of EURUSD at almost 100 pips and price is close to a psychological level, say 1.1200. It's almost a guarantee that there will be a bounce. Taking a counter move trade here will almost certainly yield pips.
The essence of this thread is for those interested in using these simple methods to alert others about potential trades that meet the outlaid criteria so they can join in on the trade if they are interested.
Please share setups when you notice a pair meet one or more of the above criteria.
If you are not a long-term trader and 20 to 50 pips per trade are good enough for you then this might make sense. For those who do not have time for over-analysis and complex trading systems this will also make sense. If you like to feel comfortable with some level of certainty that your trade will yield profit or, worse case scenario, you exit at break even or little loss, then this will also make sense.
THREAD RULES
1. The golden rule here is to stick to the described system here only so that we can keep it simple.
2. No insults or indecent language here.
Motto: Buy low; sell high
But how do you know when price is high enough for you to sell, or low enough to buy? This has always been the argument. Well, this brings us back to the title of the thread: ADR, Psychological levels, Demand and Supply.
1. Average Daily Range (ADR): As an example, the EURUSD has an ADR of 70 - 100 pips (min to max) on a daily basis. Other pairs also have theirs.
2. Psychological levels: These are known levels where price usually reacts to the opposite. Price levels ending with 00 or 50. Example: 1.1200, 113.00, 1.1450, etc. I prefer price points ending with 00 as they seem to be stronger.
3. Demand and Supply levels: These are strong levels where price has been seen to strongly bounce price away in the opposite direction. They can be easily identified on the charts as supportive or resistant areas.I prefer horizontal levels. The more times that area bounces price the stronger it becomes.
a. In addition to number 3 above, I have noticed that price often respects the 200 SMA on the 4hr timeframe and also respects the 50 SMA on the daily timeframe. I'm not an expert with MAs but these are observations that can be incorporated.
b. The .618% fib retracement also happens to also squeeze out some pips.
TRADE RULES
1. When your pair of choice gets stretched to its ADR (min -max) [the closer to the max, the better] enter a counter move trade for some retracement pips. It could be 10pips, 20 or more. I feel comfortable each time I do this knowing that the daily range is exhausted because price would rather retrace some rather than continue in its previous direction.
NB: Take extra care doing this when moves are caused by news. I generally avoid GBP pairs due to Brexit issues. I don't even touch them with a long pole for now.
2. Take a counter trade for some bounce pips when price approaches a strong 00 or 50 psychological level. This is better when this level has not been tested too recently. The beauty of this is that many times when price even manages to breach this level by a couple of pips it usually comes back at least 10 to 20 pips below/above it. I hardly use the 50 levels. The 00 levels are best.
NB: Make sure this level has not been used or breached too recently. The newer the level the better.
3. Take a counter move trade when price approaches horizontal 'demand/supply' level. I only use levels from 4hrs upwards to yearly levels. The higher the time frame, the stronger the level.
4. For those interested in moving averages, bounces also often occur when price gets to the 4hr 200 SMA or daily 50 SMA. You can also take counter trend trades from these moving averages.
5. The 61.8% fib. Price often reacts when it retraces 61.8% of a move. It's usually easy to join in on a trend using this method.
Finally, when two or more of these criteria combine then the more certain the trade result. For example, imagine the ADR of EURUSD at almost 100 pips and price is close to a psychological level, say 1.1200. It's almost a guarantee that there will be a bounce. Taking a counter move trade here will almost certainly yield pips.
The essence of this thread is for those interested in using these simple methods to alert others about potential trades that meet the outlaid criteria so they can join in on the trade if they are interested.
Please share setups when you notice a pair meet one or more of the above criteria.
Attached Image (click to enlarge)
https://www.myfxbook.com/members/mitiblotch/mt5-10567385/9464692