DislikedHello Sonickers
I am very thankful to you guys, as even though I dont post as I dont have access to this website from work, I follow this system and quite successful
The only exception I make to this system I like higher time prices but lower time volumes and I have switches timeframes to see lower time volumes
I made a first stab at changing the Sonic VSA to be MTF so that i can view volume accumulations and distributions of lower tfs from higher timeframe.
Its seems ok on the same tf, when i come with Sonic VSA but not very accurate on...Ignored
D1 for PA and sometimes lower like M5/M1 for volume) I do so by looking directly at those TF charts. Frankly, it does not take much to do this:
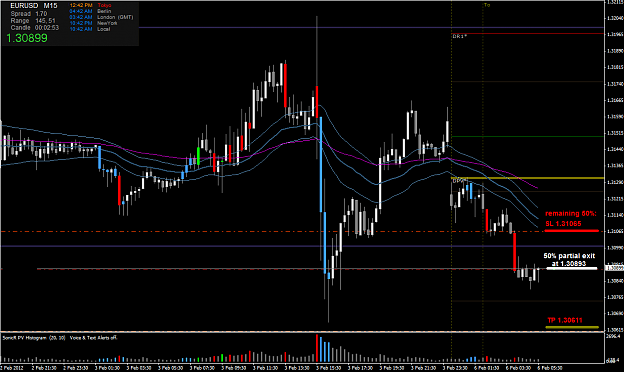
1. Put H4, M15 and M5 chart tabs on your MT4 main window, which you can quickly click back and forth on to view the entire chart of each, or
2. with those tabs you can "restore" to smaller size and view all three simultaneously side-by-side in the main MT4 window.
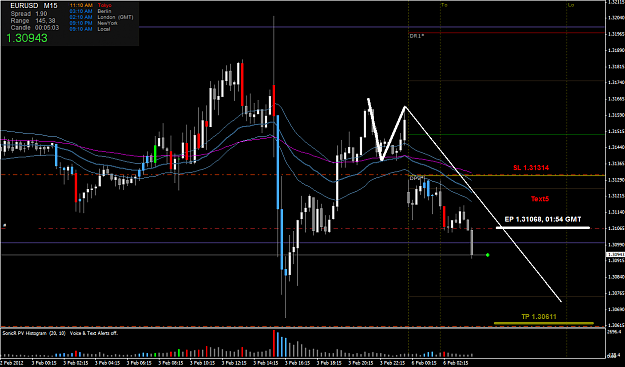
What could be easier? And, the fewer, simplier indicators you use, the better. Not to mention the less drain on your computer system. Most importantly of all, however, is the fact that PA waves and the Dragon, not volume, are the fundamental indicators. The SonicR PA Candles and SonicR PA Histogram were created to allow the candlesticks to have overlay colors to denote special volume situations shown in the volume histogram. I think this is the best use of volume with price, and it truely functions well on M15 with never needing to look at volume on other TFs.
Regards,
-tah