Dislikedi do not think that disproves my claim
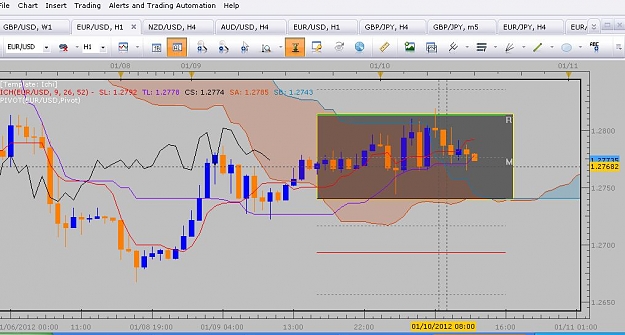
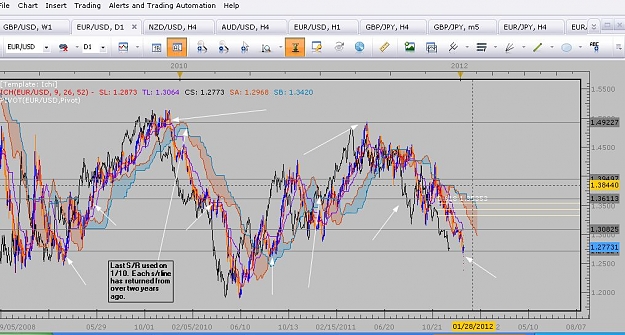
pull up the same chart and see that 1.30 was an area of support............what is the price today 1.2775?
as i said before all tools pose the question of " all things being equal............i can expect Ω to happen"
trend line= projected trajectory through velocity
s/r, s/d = historical extremes where orders execution was non existent past these levels
pivots,BB,ATR,= expected volatility
price formations= patterns of price movement
you name it...........and the question remains the same.
no...Ignored
The best tool box is of no use if you do not know how to use them........
With all the information you gave us now in this little discussion, maybe it is best to toss a coin?