This one is dedicated to Dobbie, who told me I ought to make a guide describing my methods. While theoretically I could take this system and make money off of it, I'd rather see everyone benefit. If you should so decide to claim this method as your own, so be it, and I hope you can sleep soundly at night! I would like to have credit for this though.
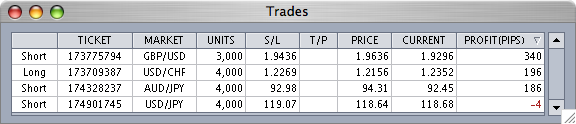
Just as a precursor, what this method COULD do for you after 6 months of backtesting:
As of now, I have started forward testing this week and am currently up about 700 PIPS in one week, which has admittedly been just a lucky catch. If I were to use my method (which I am), I would stick to volatile pairs.. i.e. GBP/USD.
So now that you know what this system COULD do, here is HOW it works:
First, get out your handy dandy Daily Chart(GBP/USD)
Then look for pivot points! Pretty easy, I know... But some of us may not know what pivot points look like, so let me describe them to you:
A price will hit a minimum or a maximum.
After that minimum or maximum, you must wait for the price to extend below the LOW (for maximums) and above the HIGH (for minimums). I usually use the spread.
A real world example:
GBP/USD
On November 16th, 2006 it reaches a Minimum of 1.8831
So, we observe the HIGH of that day, which happens to be 1.8966
We then add the spread to this, which for OANDA, the spread is typically 3.
Our magic number is 1.8969!
Now, the other part of my system...
RSI
Set an RSI(10) on your graph. I would draw 2 extra horizontal trendlines on your RSI at 40 and 60.
Now there are several scenarios(rules) that will indicate whether to actually buy in our real world example:
NOTE: If a BUY scenario is not reached within 3 days(3 BARS), then we do not act upon the pivot point. That is to say there are 3 bars between the MIN/MAX day and today.
We then sell out when the next pivot point exists, EVEN if it is 2 bars later.. Again this means a MAXIMUM must develop and the next bar must not exceed it, and also go below the LOW of the MAXIMUM.
NOTE: If a new maximum develops before the pivot point happens, we keep riding!
ALSO, we set the stop loss to either the minimum that we bought near or 100 PIPS, whichever is less.
Now I assume we are all intelligent and would be able to reverse everything for a sell position, but if you have any questions feel free to ask. The only major thing is using a value of 40 instead of 60 and 30 instead of 70 for the RSI(10) scenarios.
As they say here in Texas, there's no such thing as a dumb question.
Good luck to all
Just as a precursor, what this method COULD do for you after 6 months of backtesting:
GBP/USD 1903 PIPS
USD/CHF 1061 PIPS
AUD/JPY 692 PIPS
USD/JPY 891 PIPS
As of now, I have started forward testing this week and am currently up about 700 PIPS in one week, which has admittedly been just a lucky catch. If I were to use my method (which I am), I would stick to volatile pairs.. i.e. GBP/USD.
So now that you know what this system COULD do, here is HOW it works:
First, get out your handy dandy Daily Chart(GBP/USD)
Then look for pivot points! Pretty easy, I know... But some of us may not know what pivot points look like, so let me describe them to you:
A price will hit a minimum or a maximum.
After that minimum or maximum, you must wait for the price to extend below the LOW (for maximums) and above the HIGH (for minimums). I usually use the spread.
A real world example:
GBP/USD
On November 16th, 2006 it reaches a Minimum of 1.8831
So, we observe the HIGH of that day, which happens to be 1.8966
We then add the spread to this, which for OANDA, the spread is typically 3.
Our magic number is 1.8969!
Now, the other part of my system...
RSI
Set an RSI(10) on your graph. I would draw 2 extra horizontal trendlines on your RSI at 40 and 60.
Now there are several scenarios(rules) that will indicate whether to actually buy in our real world example:
NOTE: If a BUY scenario is not reached within 3 days(3 BARS), then we do not act upon the pivot point. That is to say there are 3 bars between the MIN/MAX day and today.
If our magic number 1.8969 is reached and the RSI(10) is sloping UP, ABOVE 50, then we BUY.
If our magic number 1.8969 is reached and the RSI(10) is sloping UP,
JUST came from 30, and now ABOVE 40, then we BUY.
If our magic number 1.8969 is reached and the RSI(10) is sloping DOWN,
ABOVE 50, we do NOTHING.
Otherwise, If our magic number 1.8969 is reached and the RSI(10) is BELOW 50 we do NOTHING.
We then sell out when the next pivot point exists, EVEN if it is 2 bars later.. Again this means a MAXIMUM must develop and the next bar must not exceed it, and also go below the LOW of the MAXIMUM.
NOTE: If a new maximum develops before the pivot point happens, we keep riding!
ALSO, we set the stop loss to either the minimum that we bought near or 100 PIPS, whichever is less.
Now I assume we are all intelligent and would be able to reverse everything for a sell position, but if you have any questions feel free to ask. The only major thing is using a value of 40 instead of 60 and 30 instead of 70 for the RSI(10) scenarios.
As they say here in Texas, there's no such thing as a dumb question.
Good luck to all
QuoteDislikedhttp://home.comcast.net/~guy876921/Picture_2.png
Alright, I had no photo editing software so I just used short lines... You should get the gist though...
Basically red lines are min/max's and yellow lines are the magic numbers..
Now when the magic numbers are hit that's when i check the RSI(Purple lines)
As you can see the RSI isn't quite below 60 on the first trade COMING FROM 70 (see above scenario), so I wait until it is to confirm, then sell at the green line...
I then buy at the next magic number to get rid of that trade...
With a new magic number being crossed i check the RSI again (purple line) and it is not quite above 50, so i wait until it is, then buy at the green line, and sell at the next magic number...
The process keeps repeating, but you don't always buy and sell... you must see what the scenario is.