• Home
  • Forums
  • Trades
  • News
  • Calendar
  • Market
  • Brokers
  • Login
  • Join
  • 12:58am
Menu
  • Forums
  • Trades
  • News
  • Calendar
  • Market
  • Brokers
  • Login
  • Join
  • 12:58am
Sister Sites
  • Metals Mine
  • Energy EXCH
  • Crypto Craft

Options

Bookmark Thread

First Page First Unread Last Page Last Post

Print Thread

Similar Threads

Open Trade near Pivot line (Pivot Point) 14 replies

Help with daily pivot, weekly pivot on MT4 3 replies

Adaptive RSI & Pivot Point Moving Average, anyone? 1 reply

RSI Daily Pivot Point System 179 replies

Pivot point reference point? 7 replies

  • Trading Systems
  • /
  • Reply to Thread
  • Subscribe
  • 15
Attachments: RSI Daily Pivot Point System v2.0
Exit Attachments
Tags: RSI Daily Pivot Point System v2.0
Cancel

RSI Daily Pivot Point System v2.0

  • Last Post
  •  
  • Page 1 23456 10
  • Page 1 234 10
  •  
  • Post #1
  • Quote
  • First Post: Jan 18, 2007 11:19am Jan 18, 2007 11:19am
  •  kharvell
  • Joined Dec 2006 | Status: call me Kevin | 1,263 Posts
Alright then,

I have decided to make a more "newbie" friendly version. There are a few changes to the original, but mainly the (word)/(important info) ratio will be greatly reduced.

The Method

  1. Set up a Daily chart with candlesticks. Also, set an RSI(10).
  2. Look for Pivot Points. What are Pivot Points? Please see the document below.
  3. Suppose we have a Low Pivot Point, thus creating a minimum. Look at the high of the minimum candle. Write this number down.
  4. Add the spread to this number. If you do not know what spread is, please add 3 pips. This is your "magic number". Why is it magical? Because when it is surpassed you must look at the scenarios below to see if you buy.

The Scenarios

NOTE: These are BUY scenarios for when a Low Pivot has just occurred and the "magic number" has been surpassed.

  1. RSI > 50. Slope is up = BUY
  2. RSI > 40 AND JUST CAME from 30. Slope is up = BUY
  3. Otherwise, don't do anything.

NOTE: These are SELL scenarios for when a High Pivot has just occurred and the "magic number" has been surpassed.

  1. RSI < 50. Slope is down = SELL
  2. RSI < 60 AND JUST CAME from 70. Slope is down = SELL
  3. Otherwise, don't do anything.

NOTE: IF the RSI has not confirmed in more than 3 days from the pivot, do not act upon the trade.

A Note about Pivot Points

Pivot Points alternate between High Pivots and Low Pivots. In other words, you can't have 2 High Pivots or 2 Low Pivots in a row. When a LOW pivot point appears like the one featured below, you will then go into HIGH pivot mode where you are watching for a high pivot. This entails looking at the high values from then on. When you find the high values are no longer increasing, this should be a red flag that it could POTENTIALLY be a high pivot. You know it is a High Pivot when and if the magic number is surpassed. If it is indeed a high pivot, then you go into LOW pivot mode, where you look at the lows using the same process.

Stop Loss

NOTE: I do not use Take Profits. Please do not ask me what my Take Profit is.

  1. Suppose you have just bought. Your initial S/L will be at the recent Low Pivot minimum, OR 100 pips, whichever is lower. The same is true for sell positions just using the High Pivot maximum
  2. Suppose now that the BUY position you have entered is moving in your favor(UP). Move the stop loss to the low of each completed day.
  3. Suppose now that the SELL position you have entered is moving in your favor(DOWN). Move the stop loss to the high of each completed day.
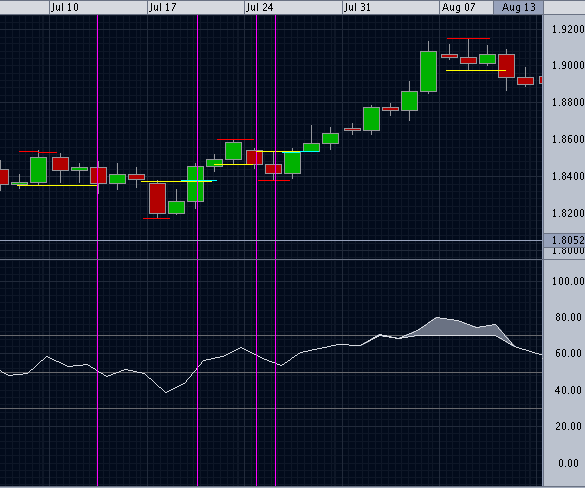
An Example Below:

  1. Red lines are the High and Low Pivots.
  2. Yellow Lines are the "magic numbers"
  3. Purple lines are me checking the RSI and scenarios to see if it is a good trade.
  4. And the 2 light blue lines are trades that qualified.

When to Increase Your Position

If you are in a long trade and the RSI's slope increases in magnitude, buy more. This means steeper slope = buy more.
The same is true for a sell trade.

Best Time of the Day to Trade

The end of the day. For me this is 8-10PM CST.


Trade at your own risk. I do not take responsibility for your losses. And most importantly GOOD LUCK!

Attached Images
  • Post #2
  • Quote
  • Jan 18, 2007 11:22am Jan 18, 2007 11:22am
  •  kharvell
  • Joined Dec 2006 | Status: call me Kevin | 1,263 Posts
Profitability

After 5 months of backtesting:

GBP/USD 1903 PIPS
USD/CHF 1061 PIPS
AUD/JPY 692 PIPS
USD/JPY 891 PIPS

Specifically, I have analyzed GBP/USD more carefully in 6 months of backtesting:

As for forward testing, since January 4th, my account has risen by 8.9%. I'm sorry I don't have any PIP values for you.
Attached Image
 
 
  • Post #3
  • Quote
  • Edited 6:04pm Jan 18, 2007 12:36pm | Edited 6:04pm
  •  yen44x
  • | Joined Dec 2006 | Status: AKA &quot;Yen&quot; | 1,654 Posts
Quoting kharvell
Disliked
Profitability

After 5 months of backtesting:

GBP/USD 1903 PIPS
USD/CHF 1061 PIPS
AUD/JPY 692 PIPS
USD/JPY 891 PIPS

Specifically, I have analyzed GBP/USD more carefully in 6 months of backtesting:

As for forward testing, since January 4th, my account has risen by 8.9%. I'm sorry I don't have any PIP values for you.
Ignored
I'm new to your system, but the genius of it appears to be its simplicity, so kudos to you if your backtesting results can be matched by your forward results.

Your back testing notes 4 currency pairs. From the 4 you chose, it appears you favor more volatile pairs for this strategy. Is that a fair conclusion?

If that's the case, it would seem that almost any JPY cross currency would be a good candidate along with the ones you mentioned, as they virtually all are somewhat volatile and trend nicely. Would you agree?

A couple of questions regarding the specifics of the system:

1.You mentioned that you review your charts between 8-10 CST. If you notice a "magic" number has been hit for a Buy signal, but RSI has not yet confirmed the trade, would you wait until you're reviewing the charts again the next evening to see if RSI has now confirmed the trade, or do you check the charts periodically the next day and enter as soon as RSI crosses?

2. Let me give you a specific example for this next question: USD/CHF reached a pivot low on 1/2/07, and there was now a "magic" number of about 1.2191 for a Buy Signal. The candle on 1/3/07 actually goes well above the buy signal and closes at about 1.2258. Under your rules, would you have suggested waiting until the close of the candle on 1/3 to enter the trade, or would you have entered as soon as the "magic" number was hit and RSI confirmed the trade?

3. I'm curious about your 6-month backtesting results on GBP/USD. Your second result shows a pip gain of 433 pips, which I'm guessing is the rally from around 7/26/06 to 8/8/06. However, wouldn't that trade have actually been stopped out on 8/3 for a much smaller gain, when the daily low was lower than the minimum low of 8/2? I'm not quibbling about the results . . . I'm just trying to make sure I understand your rules.

Thanks for your help.
Greetings from Guanajuato, Mexico
 
 
  • Post #4
  • Quote
  • Jan 18, 2007 7:38pm Jan 18, 2007 7:38pm
  •  kharvell
  • Joined Dec 2006 | Status: call me Kevin | 1,263 Posts
Answers will be found within text in red:

Quoting yen44x
Disliked
I'm new to your system, but the genius of it appears to be its simplicity, so kudos to you if your backtesting results can be matched by your forward results.

I don't know about genius, but thanks anyway

Your back testing notes 4 currency pairs. From the 4 you chose, it appears you favor more volatile pairs for this strategy. Is that a fair conclusion?

If that's the case, it would seem that almost any JPY cross currency would be a good candidate along with the ones you mentioned, as they virtually all are somewhat volatile and trend nicely. Would you agree?

Yes volatile = good. There is such a thing as too volatile though. I would say GBP/JPY is too volatile in my book, but everything else JPY would be not so bad. Since we're using a 100 pip stop loss as a max loss, it would be wise to assume that we would like more than 100 pips in our profit targets.

A couple of questions regarding the specifics of the system:

1.You mentioned that you review your charts between 8-10 CST. If you notice a "magic" number has been hit for a Buy signal, but RSI has not yet confirmed the trade, would you wait until you're reviewing the charts again the next evening to see if RSI has now confirmed the trade, or do you check the charts periodically the next day and enter as soon as RSI crosses?

Some things are discretionary. You mention below that you have 5 years of trading. I'm sure you'll be able to make a wise decision. It could be in the afternoon when you make it(2PM or later CST). It's all relative to how strong today's bar is I suppose. I would suggest trading evenings, but even I don't always follow that.. Hypocritical if you ask me

2. Let me give you a specific example for this next question: USD/CHF reached a pivot low on 1/2/07, and there was now a "magic" number of about 1.2191 for a Buy Signal. The candle on 1/3/07 actually goes well above the buy signal and closes at about 1.2258. Under your rules, would you have suggested waiting until the close of the candle on 1/3 to enter the trade, or would you have entered as soon as the "magic" number was hit and RSI confirmed the trade?

Like I said, use some discretion. After so much green, it's pretty obvious it can't go back down all that way in one day. So I'd say go for it. In fact I profited 285 Pips on the bull trend you mention there, and I bought right at the magic #. Maybe a bit too soon, but sometimes gut feeling has a lot to do with my trades.

3. I'm curious about your 6-month backtesting results on GBP/USD. Your second result shows a pip gain of 433 pips, which I'm guessing is the rally from around 7/26/06 to 8/8/06. However, wouldn't that trade have actually been stopped out on 8/3 for a much smaller gain, when the daily low was lower than the minimum low of 8/2? I'm not quibbling about the results . . . I'm just trying to make sure I understand your rules.

Good question. In that trend, I was in High Pivot mode, looking for a High Pivot. This entails looking at the high's only. As you can see, on 8/3 the high is still higher than 8/2 even though the low is lower as well. This indicates that I stay in. The real High Pivot occurs on 8/8 and I would have gotten stopped out on 8/10. It might be wise to let your s/L lag a bit behind today. 2 days sounds good.

Thanks for your help.
Ignored
Also, I was looking at your post earlier and you mentioned that you will be getting more time using my method, and that is a fact. Enjoy your time with your family my friend, and I wish you all the luck.

Kevin
 
 
  • Post #5
  • Quote
  • Jan 18, 2007 7:47pm Jan 18, 2007 7:47pm
  •  yen44x
  • | Joined Dec 2006 | Status: AKA &quot;Yen&quot; | 1,654 Posts
Kevin,

Thanks for the detail. By the way, I did my own back test on GBP/USD today because your results seemed too good to be true and I was sure you must have missed something (man, am I pessimistic or what?). In the end, though, my results pretty much mirrored yours, so I'm looking forward to "test driving" the system.
Thanks for sharing it.
Greetings from Guanajuato, Mexico
 
 
  • Post #6
  • Quote
  • Edited 11:30pm Jan 18, 2007 11:22pm | Edited 11:30pm
  •  kharvell
  • Joined Dec 2006 | Status: call me Kevin | 1,263 Posts
Quoting yen44x
Disliked
Kevin,

Thanks for the detail. By the way, I did my own back test on GBP/USD today because your results seemed too good to be true and I was sure you must have missed something (man, am I pessimistic or what?). In the end, though, my results pretty much mirrored yours, so I'm looking forward to "test driving" the system.
Thanks for sharing it.
Ignored

It's nice to know that someone is actually trying to prove me wrong! I've always considered myself an optimist, but what would the world be without pessimism? And I wish you luck with my system! Please let me know your results.

Quote
Disliked
How about Long EUR/USD soon????

Piece of the Pie,

I believe EUR/USD would be good as long as RSI crosses above 50 by Monday. I am weary about trading on Mondays, however. So much can happen over a weekend.. See how Monday turns out if it even gets there. It could be that Friday has a killer day and all systems are go. We'll have to see
 
 
  • Post #7
  • Quote
  • Jan 18, 2007 11:54pm Jan 18, 2007 11:54pm
  •  guppy
  • | Joined Jan 2006 | Status: Member | 17 Posts
thanks kharvell seems like a nice simple system. Looking forward to test it.
 
 
  • Post #8
  • Quote
  • Jan 19, 2007 12:06am Jan 19, 2007 12:06am
  •  kharvell
  • Joined Dec 2006 | Status: call me Kevin | 1,263 Posts
Quoting guppy
Disliked
thanks kharvell seems like a nice simple system. Looking forward to test it.
Ignored
Hey guppy,
I look forward to hearing your results. Thanks and good luck!
Kevin

Quote
Disliked
EUR/JPY Long since Tuesday. + 130pips.

Piece of the Pie,
Had some time to look over EUR/JPY. What made you decide to enter on tuesday vs. say Jan. 11th?
Kevin
 
 
  • Post #9
  • Quote
  • Jan 19, 2007 7:41am Jan 19, 2007 7:41am
  •  howard
  • | Joined Sep 2006 | Status: howard | 1,681 Posts
Hi Kevin

We had a pivot low on eur/jpy on the 8th and rsi crossed 50 level on the 11th; it has been a good trade so far, stop is at 155.91 below yesterday's low.

On the 11th a pivot high was also formed but no confirmation on rsi
Regards
 
 
  • Post #10
  • Quote
  • Jan 19, 2007 9:14am Jan 19, 2007 9:14am
  •  WodWave
  • | Joined Aug 2004 | Status: Member | 10 Posts
Kharvell,

I have some doubts about timing of the trade (buy or sell).

For example?
You have the low pivot
candle 1
candle 2 (lowest low)
candle 3

Just to clarify:

1) Do you wait for the close of candle 3 to buy (if conditions of RSI are ok)?
Or
2) you buy anytime during candle 3 since the price (on that moment) is higher than high of candle 2 and RSI conditions are ok (on that moment)?

The close of candle 3 can be really far from high candle 2, what can affect the results, in my opinion.

Now I can check the graphs just once a day, 0 GMT on close of daily candle on my graph. This is why I am asking this.
 
 
  • Post #11
  • Quote
  • Jan 19, 2007 9:21am Jan 19, 2007 9:21am
  •  kharvell
  • Joined Dec 2006 | Status: call me Kevin | 1,263 Posts
Answer is in Red below:

Quoting WodWave
Disliked
Kharvell,

I have some doubts about timing of the trade (buy or sell).

For example?
You have the low pivot
candle 1
candle 2 (lowest low)
candle 3

Just to clarify:

1) Do you wait for the close of candle 3 to buy (if conditions of RSI are ok)?
Or
2) you buy anytime during candle 3 since the price (on that moment) is higher than high of candle 2 and RSI conditions are ok (on that moment)?
I will tell you the same thing I told yen44 above:
Like I said, use some discretion. After so much green, it's pretty obvious it can't go back down all that way in one day. So I'd say go for it. In fact I profited 285 Pips on the bull trend you mention there, and I bought right at the magic #. Maybe a bit too soon, but sometimes gut feeling has a lot to do with my trades.

And you're right that a candle can move a lot in one day, but typically if this happens, it's the beginning of a trend. Therefore, catching it at the end wouldn't be so bad, you just might miss 50-75 pips or so. The backtesting results were done mostly waiting for the close, and profits were still significant. I'll let you be the judge. Make my method one that's good for you.
The close of candle 3 can be really far from high candle 2, what can affect the results, in my opinion.

Now I can check the graphs just once a day, 0 GMT on close of daily candle on my graph. This is why I am asking this.
Ignored
 
 
  • Post #12
  • Quote
  • Jan 19, 2007 9:25am Jan 19, 2007 9:25am
  •  kharvell
  • Joined Dec 2006 | Status: call me Kevin | 1,263 Posts
Also,

If you want a good example of why I chose this rule, please look at USD/CHF yesterday. I bought at 1.2521 when the green bar was waaay up. As you can see it met some major resistance and ended up going up just a bit.
Would you rather buy when I did or at the close?
 
 
  • Post #13
  • Quote
  • Jan 19, 2007 11:15am Jan 19, 2007 11:15am
  •  yen44x
  • | Joined Dec 2006 | Status: AKA &quot;Yen&quot; | 1,654 Posts
Kevin,

I'm new to the system so bear with me on some of the questions.

1. Do you consider the USD/CHF candle on 1/18 to be both a pivot high & pivot low at this point. In other words, would you place entry orders on both sides of that candle?

2. Have you found it advisable using your system to place entry orders on Friday and let them sit over the weekend?

Thanks!
Greetings from Guanajuato, Mexico
 
 
  • Post #14
  • Quote
  • Jan 19, 2007 1:10pm Jan 19, 2007 1:10pm
  •  kharvell
  • Joined Dec 2006 | Status: call me Kevin | 1,263 Posts
Answers are in the text

Quoting yen44x
Disliked
Kevin,

I'm new to the system so bear with me on some of the questions.

Nooo problem:

1. Do you consider the USD/CHF candle on 1/18 to be both a pivot high & pivot low at this point. In other words, would you place entry orders on both sides of that candle?

The candle on 1/18 is neither a high pivot nor low pivot. The true low pivot occurs on 1/16. We are then looking at the High's in High Pivot mode. As you can see, the high's have been increasing since then except for today, and today is far from over.

2. Have you found it advisable using your system to place entry orders on Friday and let them sit over the weekend?

I've found it doesn't seem to make too much of a difference. At the same time, I would approach this with caution. Caution meaning the signal is "ideal". For instance, if RSI is above 70 and sloping up, and you BUY on a Friday. This is not "ideal" so maybe use a smaller lot size. There are little nuances that will become clear with time.

Thanks!
Anytime.
Ignored
 
 
  • Post #15
  • Quote
  • Edited 1:31pm Jan 19, 2007 1:29pm | Edited 1:31pm
  •  yen44x
  • | Joined Dec 2006 | Status: AKA &quot;Yen&quot; | 1,654 Posts
Quoting kharvell
Disliked
Answers are in the text
Ignored
Hi Kevin . . .

1. I see what you mean about the USD/CHF candle of 1/16 being the low pivot. In regard to asking about the 1/18 candle being the high pivot, I may have been jumping the gun since the trading day is not over. Let me rephrase the question . . . if today's candle ends about where it is now, would you consider the 1/18 candle the new high pivot in your system?

2. In regard to today's AUD/JPY candle, my charts show a high slightly above the previous day. Since the two highs are very close, but the lows for the two days are over 50 pips aparts, where would you suggest placing your Sell order if the RSI meets the criteria?

By the way, my charting system has an Indicator called "Fractals" that automatically highlights what you're calling the high and low pivots. I've also seen them referred to as "Swing High" and "Swing Low" candles.

In reading through all your posts, you've shown remarkable patience in answering questions, so thanks again.
Greetings from Guanajuato, Mexico
 
 
  • Post #16
  • Quote
  • Jan 19, 2007 2:11pm Jan 19, 2007 2:11pm
  •  kharvell
  • Joined Dec 2006 | Status: call me Kevin | 1,263 Posts
You know the drill

Quoting yen44x
Disliked
Hi Kevin . . .

1. I see what you mean about the USD/CHF candle of 1/16 being the low pivot. In regard to asking about the 1/18 candle being the high pivot, I may have been jumping the gun since the trading day is not over. Let me rephrase the question . . . if today's candle ends about where it is now, would you consider the 1/18 candle the new high pivot in your system?

Ahhh.. Good question. If today stays as is then yesterday could POTENTIALLY be our high pivot. We will know that it is for certain our high pivot when the low is broken.

2. In regard to today's AUD/JPY candle, my charts show a high slightly above the previous day. Since the two highs are very close, but the lows for the two days are over 50 pips aparts, where would you suggest placing your Sell order if the RSI meets the criteria?

I would consider selling if and only if that RSI turns out looking a lot better. What I mean by this is that is must drop below 60 next with a negative slope. Personally, a feeling I am getting is that AUD/JPY still has some gas left and might keep going up, but we'll just have to see. But in regards to the potential High Pivot here, you've got the right idea. We just need RSI to confirm.

By the way, my charting system has an Indicator called "Fractals" that automatically highlights what you're calling the high and low pivots. I've also seen them referred to as "Swing High" and "Swing Low" candles.

Yes, I remember someone else referring to them as Fractals. Personally, I've never tried any automated indicators, so I would say my knowledge on the subject is limited. I think once I get some money saved up, I will look more into advancing my "trade station". And Swing High and Low sounds fine. You can call them Ed and Fred for all I care; I just think it's the idea that's important

In reading through all your posts, you've shown remarkable patience in answering questions, so thanks again.

My pleasure. You seem to have gotten the main points. This little stuff will cost you very little, but I admire your willingness to learn.
Ignored
 
 
  • Post #17
  • Quote
  • Jan 19, 2007 2:53pm Jan 19, 2007 2:53pm
  •  kharvell
  • Joined Dec 2006 | Status: call me Kevin | 1,263 Posts
I have no realized gains but unrealized gains are decent. Feel free to post your trades for comments and criticisms

My trades:

Long GBP/USD @ 1.9643 S/L 1.9633 = 94 pips
Long AUD/JPY @ 94.87 S/L 95.07 = 82 pips
Long USD/JPY @ 120.68 S/L 120.32 = 58 pips
Long USD/CHF @ 1.2521 S/L 1.2416 = -46 pips
Net Unrealized pips = 188
 
 
  • Post #18
  • Quote
  • Jan 19, 2007 3:48pm Jan 19, 2007 3:48pm
  •  MillerHighLife
  • | Joined Dec 2006 | Status: Member | 62 Posts
Have you looked at applying this system on smaller time frames? Such as hour or even 15 min. charts?
 
 
  • Post #19
  • Quote
  • Jan 19, 2007 3:53pm Jan 19, 2007 3:53pm
  •  Northpro
  • | Joined Aug 2006 | Status: Member | 551 Posts
Quoting kharvell
Disliked
Profitability

After 5 months of backtesting:

GBP/USD 1903 PIPS
USD/CHF 1061 PIPS
AUD/JPY 692 PIPS
USD/JPY 891 PIPS

Specifically, I have analyzed GBP/USD more carefully in 6 months of backtesting:

As for forward testing, since January 4th, my account has risen by 8.9%. I'm sorry I don't have any PIP values for you.
Ignored
Kharvell,

Congrats on developping your simple yet effective system. In doing reseach for backing up Wavetrade Daily and Weekly, along with Elliott Wave entries and exits, we looked at RSI as a primary indicator for probability of direction and timing. Although we developped a system similar to yours, we don't employ the standard daily pivots and have different criteria for entry and exit for each pair, thus far backtested. The results are promissing as are yours and are similar in net pips and success factor %. We are still a work in progress and forward testing is yet to be engaged..as you know forward testing and backtesting are two complete different animals!

Keep up the great work, will be watching with interest. Best of luck.

Cheers,
Northpro
 
 
  • Post #20
  • Quote
  • Jan 19, 2007 4:24pm Jan 19, 2007 4:24pm
  •  kharvell
  • Joined Dec 2006 | Status: call me Kevin | 1,263 Posts
Quoting MillerHighLife
Disliked
Have you looked at applying this system on smaller time frames? Such as hour or even 15 min. charts?
Ignored
Yes, backtests indicate that whipsaws would cause a significant increase in losses. This fact combined with the ineviatble lower profit targets, make the system worse. When I have a good solid free week, I have plans to come up with another simple system that will work in smaller time frames. It more than likely will have more filters due to fluctuations on smaller time frames. I imagine that it will have "RSI Daily Pivot Point System"-esque qualities, but will be a different animal.

Quote
Disliked
Kharvell,

Congrats on developping your simple yet effective system. In doing reseach for backing up Wavetrade Daily and Weekly, along with Elliott Wave entries and exits, we looked at RSI as a primary indicator for probability of direction and timing. Although we developped a system similar to yours, we don't employ the standard daily pivots and have different criteria for entry and exit for each pair, thus far backtested. The results are promissing as are yours and are similar in net pips and success factor %. We are still a work in progress and forward testing is yet to be engaged..as you know forward testing and backtesting are two complete different animals!

Keep up the great work, will be watching with interest. Best of luck.

Cheers,
Northpro

Northpro,

Thank you for your compliments. I'm interested in hearing more about your system when you have completed it. Please let me know. And you are dead on about forward and backtesting being two animals. I find it hard not to let emotions(or "gut feelings") come into play. Anyway, good luck to you!

Best wishes,
Kevin
 
 
  • Trading Systems
  • /
  • RSI Daily Pivot Point System v2.0
  • Reply to Thread
    • Page 1 23456 10
    • Page 1 234 10
0 traders viewing now
  • More
Top of Page
  • Facebook
  • Twitter
About FF
  • Mission
  • Products
  • User Guide
  • Media Kit
  • Blog
  • Contact
FF Products
  • Forums
  • Trades
  • Calendar
  • News
  • Market
  • Brokers
  • Trade Explorer
FF Website
  • Homepage
  • Search
  • Members
  • Report a Bug
Follow FF
  • Facebook
  • Twitter

FF Sister Sites:

  • Metals Mine
  • Energy EXCH
  • Crypto Craft

Forex Factory® is a brand of Fair Economy, Inc.

Terms of Service / ©2023