Dislikedi'm technical analyzer! not a fundamental analyzer...
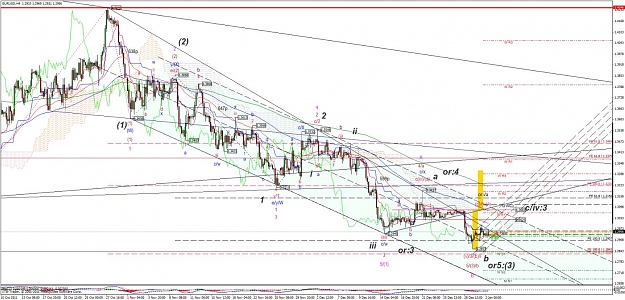
i found a no ideal gartly pattern in EU weekly chart....
Price fell In a BAT harmonic pattern...
price grow up...
then price fell in a rythmic AB=CD patternIgnored
I looked at your chart again....and looked to see what you mean by AB=CD.
Is that AB really equals to CD? was that a true calculated Gartley butterfly or BAT if thats what it is.
Was it possible to draw that gartley before it actually happened? Then how can predicton be based on assumption.
Again my question remains if your arrow is Up then to what limits price wise before any Violation to the downtrend. And can it not go another few hundred pips before a significant reverse or even no reverse at all. From my view 1.3150 remains a hard to break resistence and there could be more loses.
If it is going anywhere near 1.3150 then it should be an impulse move so need to see if it can even break the last high @ 1.2998 first...and then last stubborn support @ 1.3016-25.
Markets are not Random, they are designed!