Appreciate any comments on this demo setup...
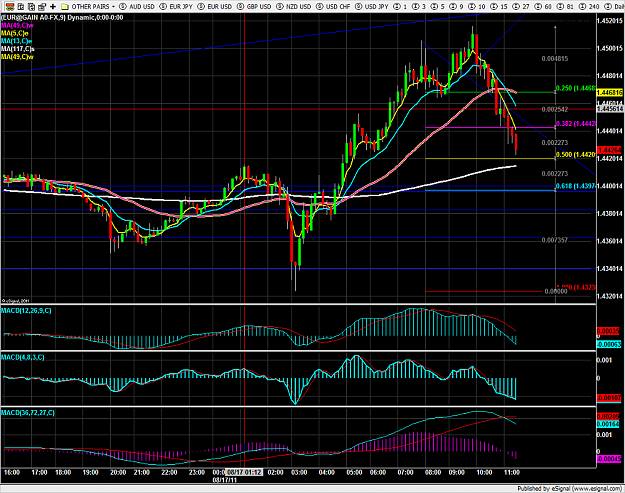
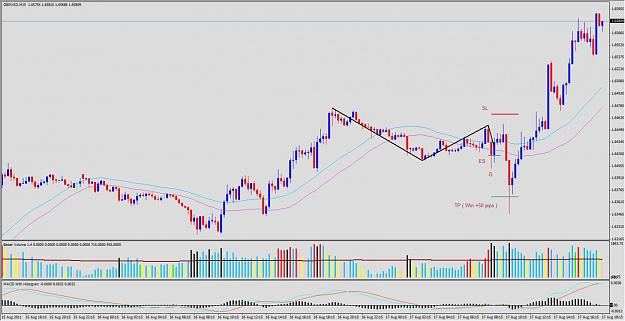
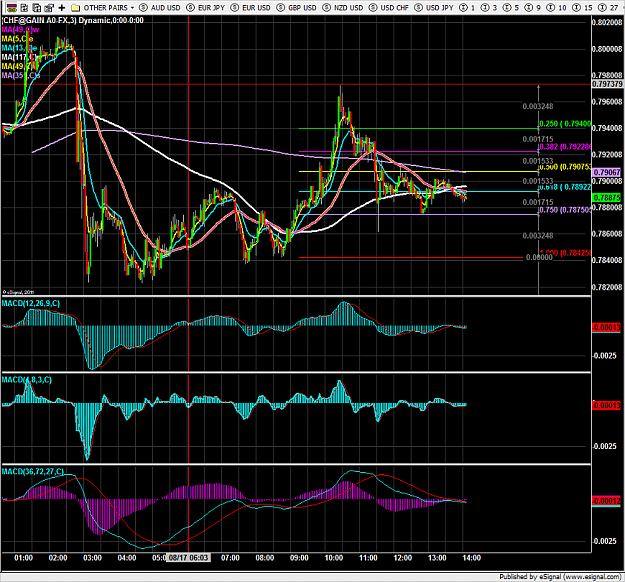
Chart 1 shows 4H, with major s/r areas marked with magenta lines. Bias is up on 4H for me.
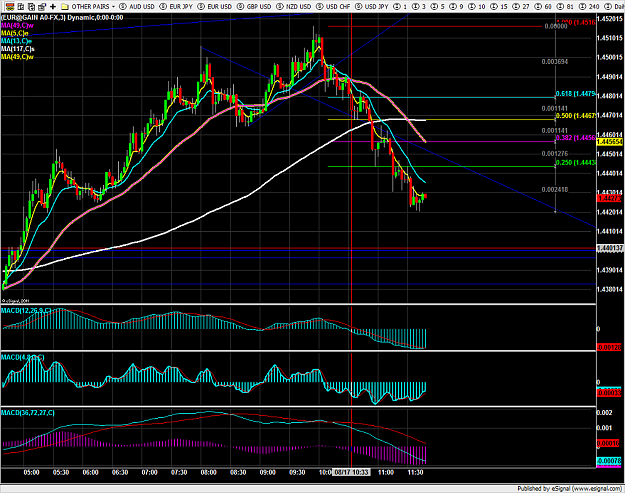
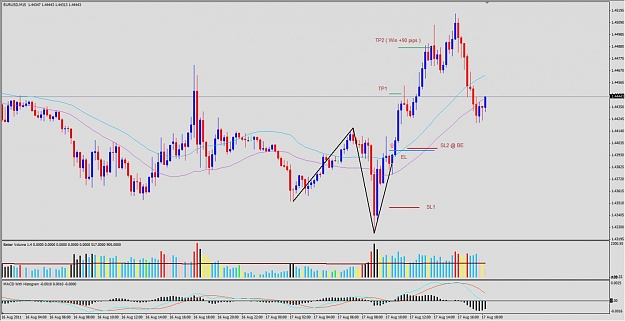
Chart 2 shows entry zoomed in and third shows entry zoomed out to see the TP levels...TP2 coincides with my 4H resistanace line.
Would anyone else trade this, why or why not? Thanks in advance
Chart 1 shows 4H, with major s/r areas marked with magenta lines. Bias is up on 4H for me.
Chart 2 shows entry zoomed in and third shows entry zoomed out to see the TP levels...TP2 coincides with my 4H resistanace line.
Would anyone else trade this, why or why not? Thanks in advance
Attached Image(s) (click to enlarge)