DislikedI agree with Bez that the daily trend is the most important on the 4HR (being the next TF up). Its a very nice bonus if the weekly and even the monthly is going in the same direction as our trade but waiting for this would rule out too many trades. I also like bez's 50 rule (only take longs below the 50 and shorts above the 50 on the TDI).Ignored
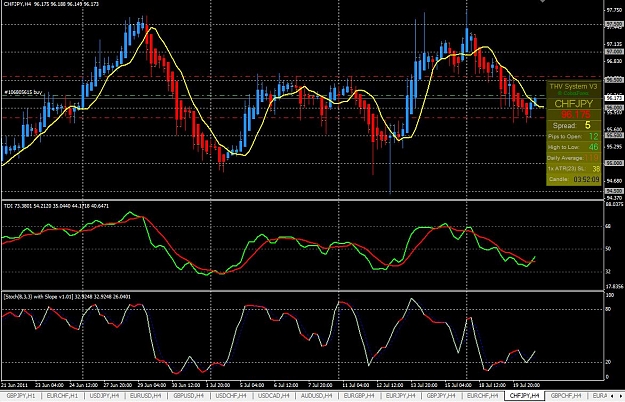
FOr example.....lets say you have ll the criteria set up nicely for a BUY on your 4 hour chart. You then click up to your daily and look for what?? just the last candle to be blue??? Do you get what I am saying...see this chart....the very last candle is blue, but the overall trend is really down not up wouldnt you agree??
so you are saying just the last candle colour on the daily chart is all you look at??
Attached Image (click to enlarge)