I just read the rules for this system...As i see it there isnt much difference between Stoch and TDI indicator. So basically, everybody here enters when Stoch (or a close version of it) is pointing up? And you are making money? Are you all insane or am i?
I just read the rules for this system...As i see it there isnt much difference between Stoch and TDI indicator. So basically, everybody here enters when Stoch (or a close version of it) is pointing up? And you are making money? Are you all insane or am i?
Ignored
welcome to the asylum...you can never leave...mwaahaahaahhaahaa
You need to have an exit strategy that you can stick to before entering a trade. Weather it is as spelled out on page one or a tweaked version, then when you exit you have not exited to early but as your strategy directs you to.
I for example have three ways to exit:
TDI crossing against me.
opposite color candle CLOSING!
S&R area reached.
Ignored
bez
I was just about to ask you about your exit strategy but you beat me to it.
As usual in a timely manner.
I am however a little confused about your post #8450 where you say that you are using the 5MA with a simple rather than a exponential setting.
Also is yours applied to the close or the Typical price? I am aware that there are some different opinions on using a shift 2 or 3, but I am puzzeled about the MA method setting.
Please let me know if I am misreading something here.
In any case thanks for all your great posts.
FXArcher
Could you point out what do you mean by 12-2..4-6.
Ignored
I don't mean this to sound like a jerk but this has been answered many, many, many, many times in this thread.
Think of a clock. The angle of the green line for a buy has to look like it is pointing to the 12-2 o'clock position on the clock. The angle of the green line for a sell has look like it is pointing to the 4-6 position on the clock.
I am not trying to come across rude or be insensitive to those trying to learn, just as I am, but it does get very old when the same questions are repeated over and over and over again. Especially when they have been answered so many times. It actually takes away from the rest of the thread when we have to fish through the basics of the system and the same questions all the time. No wonder this thread is almost 600 pages long. I bet a lot of posts are just repeats. Many have spent hours reading and studying the thread, pdfs, and other places. But some continue to show up to a hot thread and jump in and ask for the keys to the kingdom without reading anything previously written.
A really simplistic but effective way of judging the trend is just looking at what colour the HA candle is on the daily TF. This MTF HA indicator does the job.
Or of course just eyeball it.
Keep it simple.
Ignored
Scoops this is difficult and one of the areas myself and I am sure many others have trouble. According to your detemination you would consider this to be in an uptrend on charts lower than the daily because the daily HA candle is blue....where as I would look a the chart as a whole and consider it a down trend (as per the trendline). Which means you would be looking for longs and I would be looking for shorts.....this trend thing confuses me. ANyone out there with a more concrete method of trend determination??
hi Dean ,
i remember watching one of dean malone,s videos and he determines trend by the yellow line in the tdi.
if yellow line is going down that's the trend direction especially if you check higher tf hope this helps
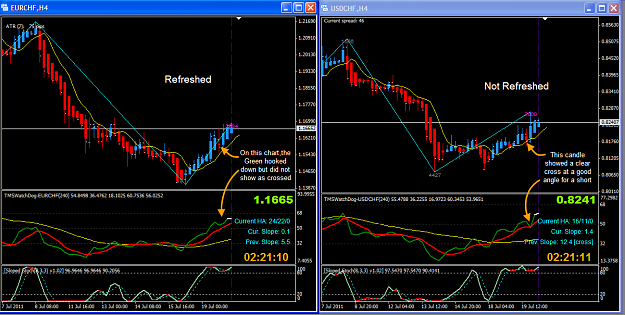
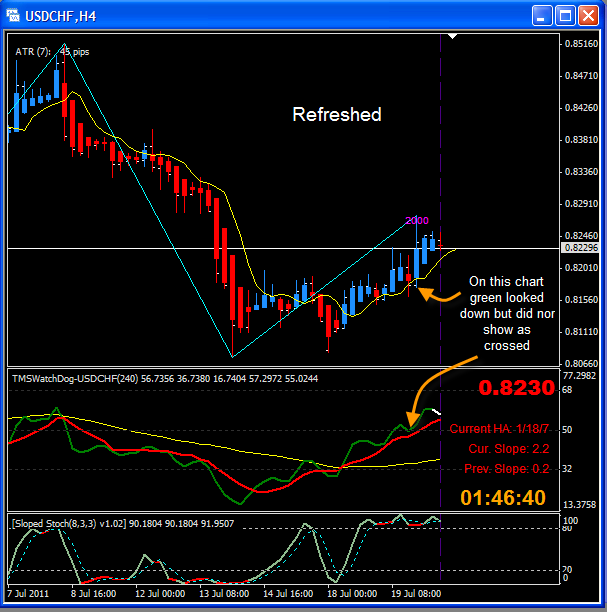
While I believe back testing is a good idea to practice the assessments of valid trades a word of caution is in order when dealing with refreshed charts, or even charts that have not been refreshed.
As shown by the example below looking at the chart on the right (Not refreshed), I was considering a Short entry on the 07 19 20 00 4Hr candle on FXDD, and I became concerned about a couple of things:
The TDI was just barely under 50 and should for me be ideally above 50, but I thought it was close enough.
The daily showed an Up Candle
As I was pondering the issue, I saw that the price was retracing as it does many times at the open, and I was considering a short several times at a better price than the open, but held off looking for a convincing down move. Honing in by checking on the 15 and then the 5 minute candle however, I saw the price moving steadily north for 100 pips in that very 4 Hr candle. So I considered myself lucky being careful watching the action unfold.
To the point now: As you can see the non refreshed chart shows a cross, but just barely. If you do look close. I have noticed in the past that the tip of the TDI, in this case the white on the Watchdog has a tendency to retract just slightly when price goes against it. I believe this is true on any standard TDI also. Even so it does not repaint. I assure you that the cross looked a lot more convincing on that chart than it does now. In addition the Watchdog indicated a Red cross at a very good angle. Now in retrospect the cross looks very weak.
If you then look at the chart that was refreshed, you can see that the green TDI is quiet a distance away from the red and does not look as if it ever even came close to indicating a short in retrospect. A far cry from what was actually the case. So I think one has to be careful when back testing the system on a chart that has been refreshed by virtue of changing timeframes or rebooting etc. as it does not show the true picture that existed at the actual time of the new candle open.
So in closing that is not to say that back testing is without merit, it is always a good idea, but those are some of the conditions one should consider.
It would be great if anyone else could comments on this. FXArcher
Scoops this is difficult and one of the areas myself and I am sure many others have trouble. According to your detemination you would consider this to be in an uptrend on charts lower than the daily because the daily HA candle is blue....where as I would look a the chart as a whole and consider it a down trend (as per the trendline). Which means you would be looking for longs and I would be looking for shorts.....this trend thing confuses me. ANyone out there with a more concrete method of trend determination??
Ignored
I agree with Bez that the daily trend is the most important on the 4HR (being the next TF up). Its a very nice bonus if the weekly and even the monthly is going in the same direction as our trade but waiting for this would rule out too many trades. I also like bez's 50 rule (only take longs below the 50 and shorts above the 50 on the TDI).
ANyone out there with a more concrete method of trend determination??
Ignored
Dean,
havent seen you round these parts for a week or so, good to see you back.
Its by no means a concrete method, but its what im using at the moment. I look at the last few weekly bars when trading H4 charts. the attached chart is what i would consider a good down down trend.
the over all trend is down , but more importantly, the last few bars are making LL's, the tdi has also crossed down which is a bonus.