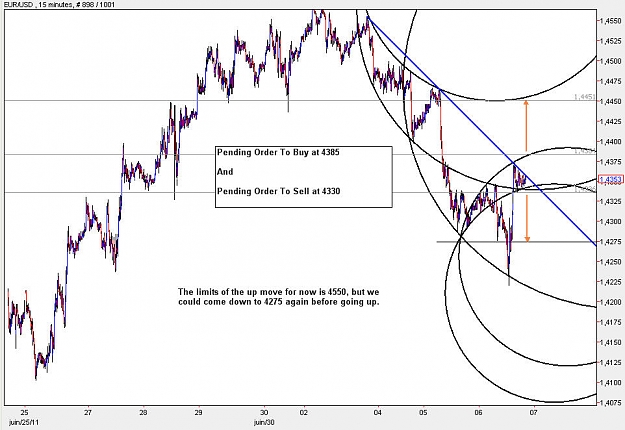
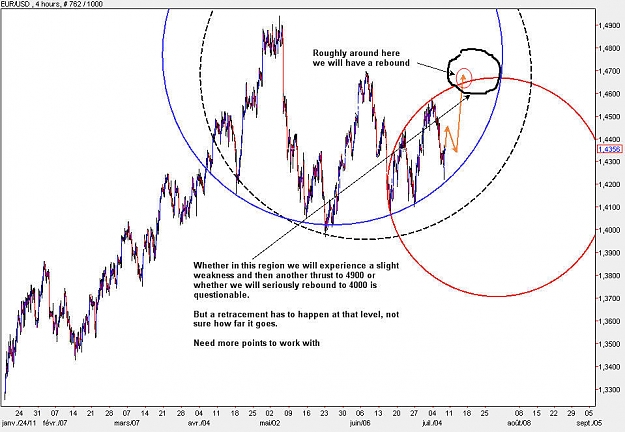
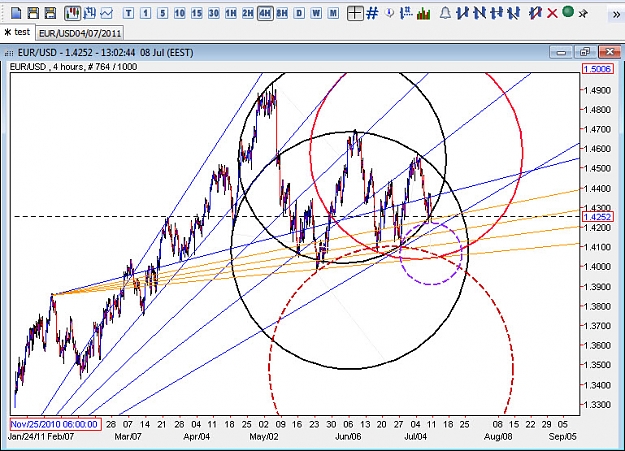
The main circle of focus was the dotted black circle, but the situation now has changed slightly and that circle has shifted few degrees to the left, and has resulted in the blue circle. The EUR will be making a comeback to the mid 4650-4680 level. Whether its going to 4900 level or dropping to 4000 level is questionable at the moment, but it would get weak as it approaches 4700 region. This is because its encountering the weak part of the blue circle, and a drop at that level has a high probability of happening, but until then we are long with a slight retracement at 4450 and heading towards the 4700 region.
The crazy situation with the EUR is why I avoid trading on Non-Farm Payrolls. From what I see the expanding triangle scenario is becoming more authentic as the last attempt of the EUR to establish a short position is becoming a failure as time goes by.
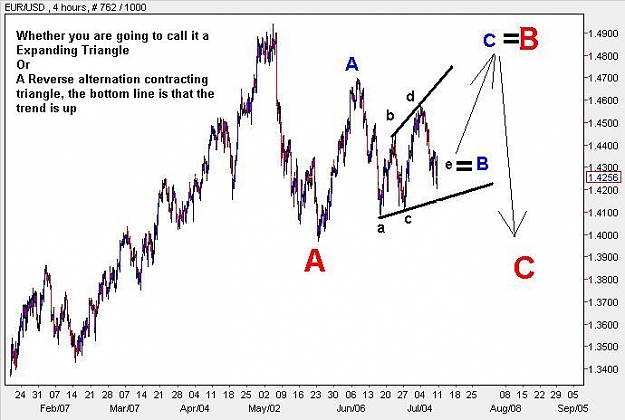
The expanding triangle scenario was presented in the following post:
The EUR is approaching the end of its triangulation. We are wave e of a triangle and a strong thrust will start that will break the b-d trendline of the triangle. I recommend long postions, and one of the characteristics of these environments is that you need at least 150-200 pips of stoploss to be able to catch a decent size move.
You can never tell with certainty where is the ending point of wave e, it might be 50 pip or 100 pip lower.
Its characteristics is very jagged movement, constant wipsaw, but it turns out to be a 3 sectional move, and we are very close to the third section getting completed.
I would estimate a thrust will start soon.
The thrust out of the triangle will take less or equal time to complete than it did for wave e to finish.
The EUR is approaching the end of its triangulation. We are wave e of a triangle and a strong thrust will start that will break the b-d trendline of the triangle. I recommend long postions, and one of the characteristics of these environments is that you need at least 150-200 pips of stoploss to be able to catch a decent size move.
You can never tell with certainty where is the ending point of wave e, it might be 50 pip or 100 pip lower.
Its characteristics is very jagged movement, constant wipsaw, but it turns out to be a 3 sectional move,...
Ignored
Because ur one of my best buddy's trader i will
Wait
review my View and Plan to b sure not miss something
and answer u when my weekly candle close
You know it really was like that, thats what Kambooj says he escapes trading NFP because you see one thing and then it does another. First it was going short and everybody started selling, then it was going long then no where.
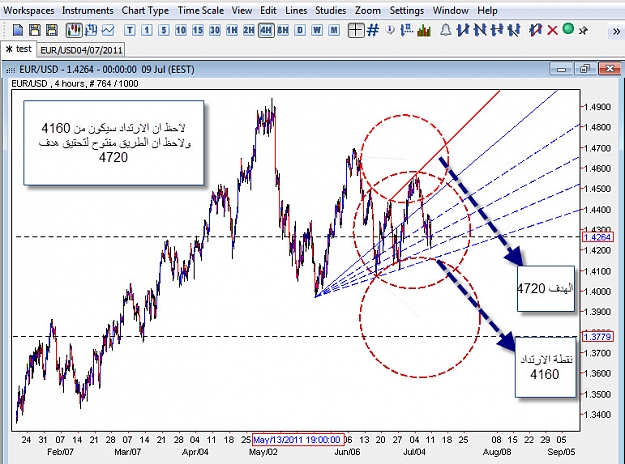
I think the 4160 strong resistance point will be able to stop the downward trend and announces completion of the triangle which he referred to Mr. Kambooj and 4720 target
God willing.
|
Additional Username
|
Joined Mar 2011
|129 Posts
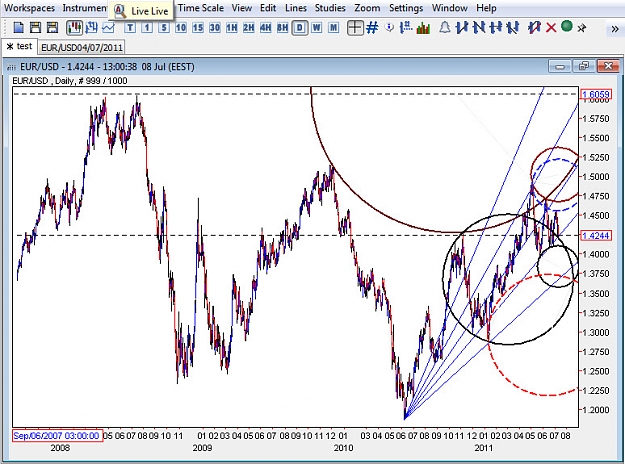
No doubt about it, we will see 4900. The chart below is strickly for long term carry trades, but if you want to figure out the perfect stoploss target it works wonderful. The 2 main trendlines are shown. The white is recent activity Triangle and the blue is pulled from way back. The 4900 is the target and the stop is anywhere in the grey area. My long term stop will be just below that area which is below the 200 moving average. I would not be surprised to see this one come back to 4170. All my stops are gauged directly off the daily time frame.
The EUR is approaching the end of its triangulation. We are wave e of a triangle and a strong thrust will start that will break the b-d trendline of the triangle. I recommend long postions, and one of the characteristics of these environments is that you need at least 150-200 pips of stoploss to be able to catch a decent size move.
You can never tell with certainty where is the ending point of wave e, it might be 50 pip or 100 pip lower.
Its characteristics is very jagged movement, constant wipsaw, but it turns out to be a 3 sectional move,...
No doubt about it, we will see 4900. The chart below is strickly for long term carry trades, but if you want to figure out the perfect stoploss target it works wonderful. The 2 main trendlines are shown. The white is recent activity Triangle and the blue is pulled from way back. The 4900 is the target and the stop is anywhere in the grey area. My long term stop will be just below that area which is below the 200 moving average. I would not be surprised to see this one come back to 4170. All my stops are gauged directly off the daily time...
Ignored
How come u b that sure !!
Market @ end do What ever it Like
AT least look to ur chart it say something Else, tell me u don't see One of strong pattern for bearish!!