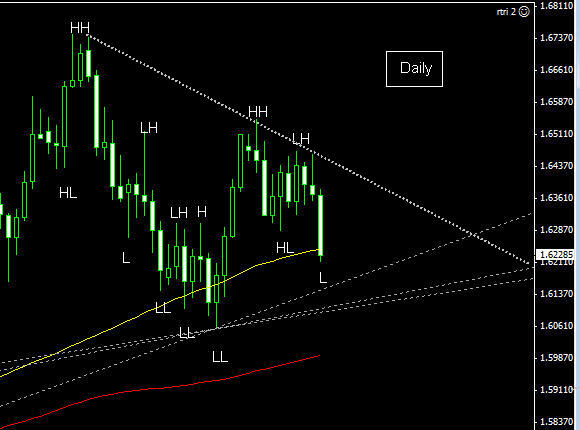
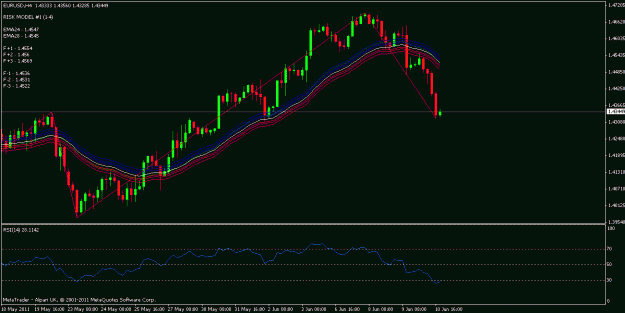
that yellow line is not a random one
we find it in daily chart
supported price in 53 area
test again few time ago when in 6060.
price slipped below it on daily but closed above.
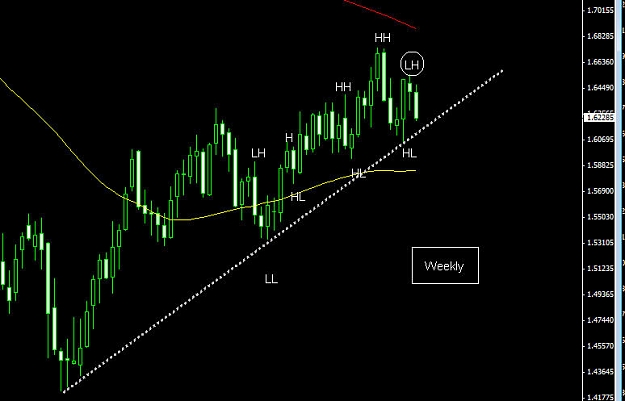
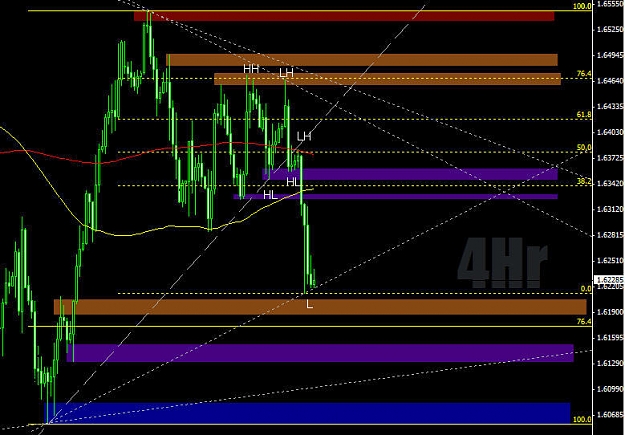
now we are again here after the peak in 65 area and the bearish flag range 6290-6460
MACD show weak and crossed downward near zero.
this would at least explain the big buy orders found on that 6211 which is also ema100 (red dotted).
so, we are in a support area but, as i said in my previous post, PA dont let me think on a recover from here.
also looking here is possible a move near 6260-6270 where price will find daily pivot, ema60 daily (blue) and a lot of other things.
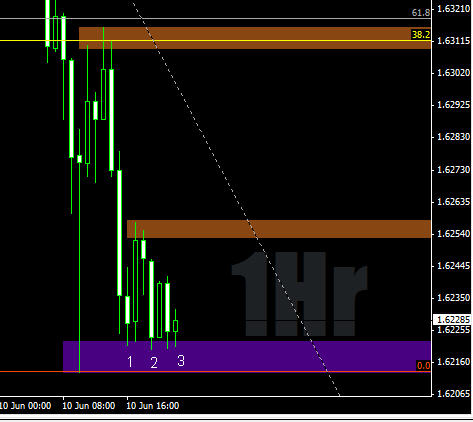
finally, my plan is to find short if goes in 6250-70 range, or find a short if goes below yellow line. no buy setup for the moment unless scalps and/or unless things completely change at start of the week.
comments are very very very welcome and needed
we find it in daily chart
supported price in 53 area
test again few time ago when in 6060.
price slipped below it on daily but closed above.
now we are again here after the peak in 65 area and the bearish flag range 6290-6460
MACD show weak and crossed downward near zero.
this would at least explain the big buy orders found on that 6211 which is also ema100 (red dotted).
so, we are in a support area but, as i said in my previous post, PA dont let me think on a recover from here.
also looking here is possible a move near 6260-6270 where price will find daily pivot, ema60 daily (blue) and a lot of other things.
finally, my plan is to find short if goes in 6250-70 range, or find a short if goes below yellow line. no buy setup for the moment unless scalps and/or unless things completely change at start of the week.
comments are very very very welcome and needed
Attached Image (click to enlarge)

90% of traders use TA, indicators and prediction