• Home
  • Forums
  • Trades
  • News
  • Calendar
  • Market
  • Brokers
  • Login
  • Join
  • User/Email: Password:
  • 1:16am
Menu
  • Forums
  • Trades
  • News
  • Calendar
  • Market
  • Brokers
  • Login
  • Join
  • 1:16am
Sister Sites
  • Metals Mine
  • Energy EXCH
  • Crypto Craft

Options

Bookmark Thread

First Page First Unread Last Page Last Post

Print Thread

Similar Threads

Monitor for 'Trading Made Simple' system 559 replies

MTF Indicators for the 'Trading Made Simple' system 241 replies

trading made simple system test 12 replies

Please suggest a simple & effective Method/System of "Trading System" Forum to newbie 176 replies

Trading Made Simple system follower - Thanks to eelfranz 9 replies

  • Platform Tech
  • /
  • Reply to Thread
  • Subscribe
  • 94
Attachments: Indicators for the 'Trading Made Simple' system
Exit Attachments
Tags: Indicators for the 'Trading Made Simple' system
Cancel

Indicators for the 'Trading Made Simple' system

  • Last Post
  •  
  • 1 34Page 567 18
  • 1 4Page 56 18
  •  
  • Post #81
  • Quote
  • Edited 4:25pm Jun 3, 2011 4:12pm | Edited 4:25pm
  •  Lain
  • | Joined Jun 2011 | Status: Member | 102 Posts
Hello,

I'm trying to build the TDI indicator in OmniTrader but I'm having a problem matching up OmniTrader's RSI with MT4s (which is the base of the TDI indicator).

I've look around the net and found the equation for RSI:
http://web.streetauthority.com/terms/r/rsi.asp
http://stockcharts.com/school/doku.p...ngth_index_rsi

When I a manual calculation for RSI it doesn't match MT4s level.

Does anyone have an idea why or what MT4 is doing different in their RSI calculation?
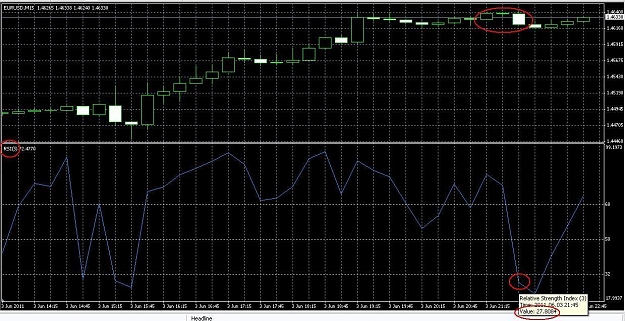
Here's an example:
RSI(3)
to keep it simple, but I've tested with longer periods and get similar results.

Close of bar one: 1.46221
Close of bar two: 1.46378
Close of bar three: 1.46378 (same as close of bar two)

According to the actual RSI equation:

Calculate all the up and down days:
1.46221 - 1.46378 = -0.00157
1.46378 - 1.46378 = 0


Average of total up days = 0 / 3 = 0
Average of total down days = 0.00157 / 3 = 0.000523

0(avg up days) / 0.000523(avg down days) = 0.000523

Add 1
1 + 0.000523 = 1.000523

100 / 1.000523 = 99.9477

100 - 99.9477 = 0.05....

So the RSI(3) for the marked day should be about 0 but MT4 is showing 27.8084

Anyone have an idea how it calculated 27.8084?


Any insight would be greatly appreciated. I've spent like 10hrs now trying to duplicate the TDI in OT and it looks like the RSI calculation is the issue. If I can figure out how it's getting 27.8084 I should be able to code OT to duplicate it.


Thank you,

Lain
Attached Image (click to enlarge)
Click to Enlarge

Name: EURUSD.JPG
Size: 153 KB
 
 
  • Post #82
  • Quote
  • Jun 5, 2011 5:23am Jun 5, 2011 5:23am
  •  busalex
  • | Joined May 2011 | Status: Junior Member | 1 Post
Quoting plamendp
Disliked

  1. Shows last 2 bars TDI Delta (slope as units per candle)
  2. Slope Histogram
  3. Alerts: Popup and Email
  4. Alerts based on slope value while Green crosses Red
  5. Repaint/Non Repaint switch
  6. Alert logging in a file under "experts/files"
  7. Multitimeframe
  8. Multisymbol
  9. Colorize last bar
  10. Equal to Big E's original "TDI" If all options are left by default

Hint: Apply several indicators on the same chart and set different currencies and/or timeframes, i.e. use its MTF/Multisymbol capabilities!

Hint: Play with...

Ignored
plamendp, please, add in your indicator (@TMS_TDI_SlopeAlert or @TMS_TDI_Slope) Yellow Market Base Line
 
 
  • Post #83
  • Quote
  • Jun 6, 2011 4:32am Jun 6, 2011 4:32am
  •  plamendp
  • | Joined Mar 2011 | Status: Member | 177 Posts
Here you go.

* Added back Up/Dn and Mid Zone (Blue/Blue and Yellow lines)
* Shows Heiken Ashi (Synergy) Candle info: Body/Upper Wick/Lower Wick
* Requires: Synergy_APB.ex4 (attached)
* Removed Histogram option
* By Default only Green and Red is are visible
* Changed Name to "TMS TDI WatchDog" to reflect the mix of TMS/TDI and alert functionality


Enjoy!
Attached File(s)
File Type: ex4 @TMSTDI_WatchDog.ex4   23 KB | 2,285 downloads
File Type: ex4 Synergy_APB.ex4   4 KB | 1,787 downloads
Bah...
 
 
  • Post #84
  • Quote
  • Jun 7, 2011 9:45pm Jun 7, 2011 9:45pm
  •  courtz
  • | Joined Jun 2011 | Status: Member | 19 Posts
Hey there,

Can anyone tell me how the watchdog actually works? In terms of:

Current HA - i get this is the HA candles but what is a good signal for buy and sell in this case?
Curr Slope - what is a good signal for buy and sell in this case?
Prev Slope - what is a good signal for buy and sell in this case?
 
 
  • Post #85
  • Quote
  • Jun 8, 2011 5:48am Jun 8, 2011 5:48am
  •  plamendp
  • | Joined Mar 2011 | Status: Member | 177 Posts
Quoting courtz
Disliked
Hey there,

Can anyone tell me how the watchdog actually works? In terms of:

Current HA - i get this is the HA candles but what is a good signal for buy and sell in this case?
Curr Slope - what is a good signal for buy and sell in this case?
Prev Slope - what is a good signal for buy and sell in this case?
Ignored
Read this thread from first post:

http://www.forexfactory.com/showthread.php?t=291622

Regards
Bah...
 
 
  • Post #86
  • Quote
  • Edited 8:37am Jun 8, 2011 8:15am | Edited 8:37am
  •  michaelwen
  • | Joined Feb 2010 | Status: Member | 99 Posts
Quoting plamendp
Disliked
Read this thread from first post:

http://www.forexfactory.com/showthread.php?t=291622

Regards
Ignored
hi, Plamendp. is that right set for your new watchDog?

and current HA: 6/0/1 . what those number means , thanks and great job on the indicator.

ps: sorry, I just clear about what those number mean. 6 is high of APB , 0 mean not up wick. and 1 mean small low wick.

OMG, you are really marvelous for make this kind indicator, thanks again.

and, Plamendp. is that possible to add alert option for APB body if reach preset number? thanks
Attached Image (click to enlarge)
Click to Enlarge

Name: eg.jpg
Size: 128 KB
 
 
  • Post #87
  • Quote
  • Jun 8, 2011 1:11pm Jun 8, 2011 1:11pm
  •  plamendp
  • | Joined Mar 2011 | Status: Member | 177 Posts
Quoting michaelwen
Disliked
hi, Plamendp. is that right set for your new watchDog?

and current HA: 6/0/1 . what those number means , thanks and great job on the indicator.

ps: sorry, I just clear about what those number mean. 6 is high of APB , 0 mean not up wick. and 1 mean small low wick.

OMG, you are really marvelous for make this kind indicator, thanks again.

and, Plamendp. is that possible to add alert option for APB body if reach preset number? thanks
Ignored
Yes, I can add a Candle/Wicks Size alert but it would be part of the Cross alert, i.e.

"If there is Cross with Slope > X *AND* Candle/Wicks are > Y then alert",

not just a Candle size alert!

Problem is the candle size alone is not enough as filter - you need to assess the candle/wicks combo PLUS the number of the candle in its color. Which makes it too complicated (not impossible, just too mich coding.. I am lazy..)

Anyway.. I'll see what can be done with minimum efforts :-)

Plamen
Bah...
 
 
  • Post #88
  • Quote
  • Jun 8, 2011 9:51pm Jun 8, 2011 9:51pm
  •  michaelwen
  • | Joined Feb 2010 | Status: Member | 99 Posts
Quoting plamendp
Disliked
Yes, I can add a Candle/Wicks Size alert but it would be part of the Cross alert, i.e.

"If there is Cross with Slope > X *AND* Candle/Wicks are > Y then alert",

not just a Candle size alert!

Problem is the candle size alone is not enough as filter - you need to assess the candle/wicks combo PLUS the number of the candle in its color. Which makes it too complicated (not impossible, just too mich coding.. I am lazy..)

Anyway.. I'll see what can be done with minimum efforts :-)

Plamen
Ignored
thanks plamendp, if my memory services me right, Big E only want big candle body size, in order said have enough force to push price . and sometime the candle size increase during the candle form, if we watch the chart , we might see it the chance to jump in. so, if you have alert give head up if candle body at preset number, we have more chance to catch the move. looks forward to your work. thanks
 
 
  • Post #89
  • Quote
  • Jun 9, 2011 10:32am Jun 9, 2011 10:32am
  •  pipnoob
  • | Joined Mar 2011 | Status: Member | 9 Posts
Plamendb,

Let me start by saying that I’m a complete noob so the numeric value for the slope is tremendously helpful. What I'm confused on is the alert. When true it alerts every tick so until the slope is below the threshold it goes off for hours (every tick on a 4H chart). Could it not just alert at the candle open?

If I have 12+ pairs on chart and there are multiple pair alerts the never ending bing bing bing is very confusing to my noobieness.

Thank you for your work.
pipnoob
 
 
  • Post #90
  • Quote
  • Jun 9, 2011 1:55pm Jun 9, 2011 1:55pm
  •  plamendp
  • | Joined Mar 2011 | Status: Member | 177 Posts
Quoting pipnoob
Disliked
Plamendb,

Let me start by saying that I’m a complete noob so the numeric value for the slope is tremendously helpful. What I'm confused on is the alert. When true it alerts every tick so until the slope is below the threshold it goes off for hours (every tick on a 4H chart). Could it not just alert at the candle open?

If I have 12+ pairs on chart and there are multiple pair alerts the never ending bing bing bing is very confusing to my noobieness.

Thank you for your work.
pipnoob
Ignored
That's very strange.... It should fire alert only once for the whole bar for a given alert (Currency Pair + Timeframe + Alert Type is the unique key)

Example:
EURUSD, H1, "CROSS UP" event: alert and then, unless a CROSS DOWN happens afterwards, this alert should not be fired until the end of the H1 bar.

How many Watchdogs you are attaching to a single chart? Hmm... Any hyperexotic currency pair ? (Bulgarian Lev against Mongol .. whatever :-) ?
Bah...
 
 
  • Post #91
  • Quote
  • Jun 9, 2011 1:58pm Jun 9, 2011 1:58pm
  •  plamendp
  • | Joined Mar 2011 | Status: Member | 177 Posts
I take no credits for this template, it can be found somewhere, but since many people asked for it, here it is: Synergy_APB in a separate window. Use this template as a starting base. Of course you need Synergy itself.
Attached File(s)
File Type: tpl #synergy_separate_window.tpl   1 KB | 1,370 downloads
Bah...
 
 
  • Post #92
  • Quote
  • Jun 9, 2011 3:22pm Jun 9, 2011 3:22pm
  •  pipnoob
  • | Joined Mar 2011 | Status: Member | 9 Posts
Believe I found the issue. My broker live account (Micro) pair names look like “EURUSDmicro” My demo account names look standard “EURUSD”. The demo account does not do this. This is the only difference between the two.

Can this be fixed or will I need to turn to the broker?

Thank you again,
pipnoob
 
 
  • Post #93
  • Quote
  • Jun 9, 2011 4:17pm Jun 9, 2011 4:17pm
  •  plamendp
  • | Joined Mar 2011 | Status: Member | 177 Posts
Quoting pipnoob
Disliked
Believe I found the issue. My broker live account (Micro) pair names look like “EURUSDmicro” My demo account names look standard “EURUSD”. The demo account does not do this. This is the only difference between the two.

Can this be fixed or will I need to turn to the broker?

Thank you again,
pipnoob
Ignored
Broker can do nothing.. I have a solution not yet coded... For now you have to wait or use your demo... One of my accounts also have suffix added .. that's why I guessed about pair names...

It will be an option to specify PREfix and/or SUFfix, if any.

regards
Bah...
 
 
  • Post #94
  • Quote
  • Jun 10, 2011 12:34am Jun 10, 2011 12:34am
  •  michaelwen
  • | Joined Feb 2010 | Status: Member | 99 Posts
Quoting plamendp
Disliked
I take no credits for this template, it can be found somewhere, but since many people asked for it, here it is: Synergy_APB in a separate window. Use this template as a starting base. Of course you need Synergy itself.
Ignored
hi, Plamendp. please take look of chart. the indicator is as attach. it is use HA bar on the price chart. but the OCHL is real match with candle OCHL. mean only color is match with HA bar. see if you can put APB code instead HA code in to this indicator, so you do not need open two window , one with candle bar , and one with APB bar. just a idea. thanks
Attached Image (click to enlarge)
Click to Enlarge

Name: ac.jpg
Size: 101 KB
Attached File(s)
File Type: mq4 #OHLC - HA.mq4   4 KB | 1,933 downloads
 
 
  • Post #95
  • Quote
  • Jun 10, 2011 2:27pm Jun 10, 2011 2:27pm
  •  plamendp
  • | Joined Mar 2011 | Status: Member | 177 Posts
Reminder:

* You need Synergy_APB indicator if HACandleInfo=true (default). You can use other Synergy or Heiken Ashi indicator of your choice. Change "SynergyIndiFileName" option. This is valid as long as your "Synergy" follows the same buffer ordering as the original Synergy.


Fixed bug:

* Alerts keep popping for weird symbols like EURUSDeur


Usage Hints:

* Apply more Watchdogs to a single chart (change CurrencyPair and/or Timeframe options) and enjoy Multysymbol/Multitimeframe "scanning".

* Placing Two identical watchdogs in a single chart is not recommended, though it is meaningless anyway

* Play with thersholds and set them on your personal discretion and sense of "good" slope and bounce


Enjoy!
Attached File(s)
File Type: ex4 @TMSTDI_WatchDog.ex4   25 KB | 1,486 downloads
Bah...
 
 
  • Post #96
  • Quote
  • Jun 10, 2011 2:41pm Jun 10, 2011 2:41pm
  •  vbmark
  • | Joined May 2011 | Status: Member | 152 Posts
Thank you plamendp, this is a very cool indicator.

Is there a way for me to make the green line be in front of the red instead of behind? I've been using TMS-Osc which has it in front and I think I prefer it that way.

Thank you again for making this.
 
 
  • Post #97
  • Quote
  • Jun 11, 2011 7:42am Jun 11, 2011 7:42am
  •  michaelwen
  • | Joined Feb 2010 | Status: Member | 99 Posts
Quoting plamendp
Disliked
Reminder:

* You need Synergy_APB indicator if HACandleInfo=true (default). You can use other Synergy or Heiken Ashi indicator of your choice. Change "SynergyIndiFileName" option. This is valid as long as your "Synergy" follows the same buffer ordering as the original Synergy.


Fixed bug:

* Alerts keep popping for weird symbols like EURUSDeur


Usage Hints:

* Apply more Watchdogs to a single chart (change CurrencyPair and/or Timeframe options) and enjoy Multysymbol/Multitimeframe "scanning".

* Placing Two identical watchdogs...
Ignored
hi, plamendp. try to find out what is that mean. could you attach a chart and explain. thanks.

* Apply more Watchdogs to a single chart (change CurrencyPair and/or Timeframe options) and enjoy Multysymbol/Multitimeframe "scanning".
 
 
  • Post #98
  • Quote
  • Jun 17, 2011 9:26am Jun 17, 2011 9:26am
  •  Callisto
  • | Additional Username | Joined Jun 2011 | 421 Posts
Quoting rbuki
Disliked
Hi,
can you tell me that certain slope value how can be calculated as a clock hand position (e.g. 1 o clock) or into degrees (e.g. 1 o clock is 15 degrees)? Thanks.
Ric
Ignored
Basic 6 grade math, circle has 360 degrees, divide by 12 = 30 degrees

Or think of a right angle, 90 degrees, must be 3 o'clock, hence, 1 = 30 degrees, 2 = 60, 3 = 90, 6 = 180
OPPORTUNITY IS NOWHERE
 
 
  • Post #99
  • Quote
  • Jun 20, 2011 8:54am Jun 20, 2011 8:54am
  •  plamendp
  • | Joined Mar 2011 | Status: Member | 177 Posts
Among some cosmetic changes:


* Added option haCandleSizeThreshold. If the Synergy candle body size is smaller than this value (NO plus on minus sign needed!!!!!) no alert(s) gonna be fired. Default = 0, i.e. it doesn't matter, fire alert as far as the candle is bigger than zero.

* Reminder: you need Synergy Indicator for this indicator to work! (attached)

Enjoy!
Attached File(s)
File Type: ex4 @TMSTDI_WatchDog.ex4   25 KB | 1,467 downloads
File Type: ex4 Synergy_APB.ex4   4 KB | 1,496 downloads
Bah...
 
 
  • Post #100
  • Quote
  • Jun 20, 2011 9:23am Jun 20, 2011 9:23am
  •  2scoops
  • | Joined Jan 2011 | Status: No Longer Trading | 546 Posts
Nice work Plamen - I'll test this tonight - thanks
 
 
  • Platform Tech
  • /
  • Indicators for the 'Trading Made Simple' system
  • Reply to Thread
    • 1 34Page 567 18
    • 1 4Page 56 18
0 traders viewing now
  • More
Top of Page
  • Facebook
  • Twitter
About FF
  • Mission
  • Products
  • User Guide
  • Media Kit
  • Blog
  • Contact
FF Products
  • Forums
  • Trades
  • Calendar
  • News
  • Market
  • Brokers
  • Trade Explorer
FF Website
  • Homepage
  • Search
  • Members
  • Report a Bug
Follow FF
  • Facebook
  • Twitter

FF Sister Sites:

  • Metals Mine
  • Energy EXCH
  • Crypto Craft

Forex Factory® is a brand of Fair Economy, Inc.

Terms of Service / ©2023