Funny, I was going to point out that in my view the Euro is still going down to around 13900 and then I read Sive Morton signal just now: There is a bearish context. Probably market will reach 1.3950 area before any pullback could start. Anyway, we need some turning in intraday momentum, prior to even think about long positions.
So with the poor economic news weighing cable down as well as the fact that no sign of interest rate rise, I can't see any reason to buy GBP also at the moment!
Still I may be wrong and Monday might see retracement. Usually though after a big move the market is very choppy so I doubt if I'll be trading tomorrow until we see which way the wind is going to blow!
on 2nd look, once we reach the daily 200ema, the 1hour 200ema will probably be sitting around the latest point of what is now resistance at 6245 which is exactly the 68.2 retrace on the daily and is clearly respected as such on the 1 hourly timeframe.
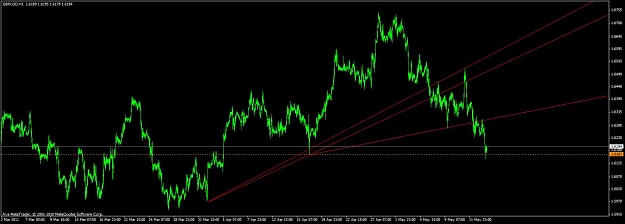
Idea for next few days on 1 hour chart. Crude i know but I don't know about drawing tools available to me. Lower red line is daily 200ema at 1.6 whole number and highs of August last year. back up to current 61.8 retrace, resistance zone and base of head and shoulders pattern and where 1 hour 200ema should be by then. After this, it could head furthe up to the 4 hour 200ema or back down, not sure. Any thoughts?
Idea for next few days on 1 hour chart. Crude i know but I don't know about drawing tools available to me. Lower red line is daily 200ema at 1.6 whole number and highs of August last year. back up to current 61.8 retrace, resistance zone and base of head and shoulders pattern and where 1 hour 200ema should be by then. After this, it could head furthe up to the 4 hour 200ema or back down, not sure. Any thoughts?
Idea for next few days on 1 hour chart. Crude i know but I don't know about drawing tools available to me. Lower red line is daily 200ema at 1.6 whole number and highs of August last year. back up to current 61.8 retrace, resistance zone and base of head and shoulders pattern and where 1 hour 200ema should be by then. After this, it could head furthe up to the 4 hour 200ema or back down, not sure. Any thoughts?
Ignored
i agree on daily 61% fibo and daily ema 200 are 2 good levels to think on a up/down into this area.
i drawn and wrote it big on my chart, near those levels price can give good pullbacks
6060 is also 85,4% same retrace.
i think will be both tested next days
hello,
sorry for my question i could be wrong, just need to share it.
isn't it neckline in 6162 (near) line?
Ignored
I see what you are saying. If you take the extremes of price movement then yes. I tend to focus on multiple reasons for a decision and look at where the mass of whipsaw action takes place. I see 6245 as the base since this is the area of what was the most recent area of support (to the left of the body) that has now become resistance and whipsaw activity, it is also the 61.8 retrace on the daily which price closed below on Friday. I feel this could be be a sub important zone for the day / swing trader for the next few days or more.
I see what you are saying. If you take the extremes of price movement then yes. I tend to focus on multiple reasons for a decision and look at where the mass of whipsaw action takes place. I see 6245 as the base since this is the area of what was the most recent area of support (to the left of the body) that has now become resistance and whipsaw activity, it is also the 61.8 retrace on the daily which price closed below on Friday. I feel this could be be a sub important zone for the day / swing trader for the next few days or more.
Ignored
yes true!
thanks.
imo 6226-6230 maybe 6250 shuld come as test
i agree on daily 61% fibo and daily ema 200 are 2 good levels to think on a up/down into this area.
i drawn and wrote it big on my chart, near those levels price can give good pullbacks
6060 is also 85,4% same retrace.
i think will be both tested next days
yes true!
thanks.
imo 6226-6230 maybe 6250 shuld come as test
Ignored
Yes, I am jumping in early this morning (Australian time) at 6220 as this gives me around a 10/1 risk reward down to 1.6 with 1 or 2 closed hour bars above 6245 as my stop and I hate missing retracement entries by a pip or 2 for a 200+ pip move.
It was quite a firm break below the 61.8 retrace so I would not bother with any pending orders above 6225, as I don't think it will come all the way up and retest the true support zone at 6245.
Funny, I was going to point out that in my view the Euro is still going down to around 13900 and then I read Sive Morton signal just now: There is a bearish context. Probably market will reach 1.3950 area before any pullback could start. Anyway, we need some turning in intraday momentum, prior to even think about long positions.
So with the poor economic news weighing cable down as well as the fact that no sign of interest rate rise, I can't see any reason to buy GBP also at the moment!
Still...
Ignored
You're welcome
As I expected everything goes as I expected it was just a retracement
GU is going to southpole