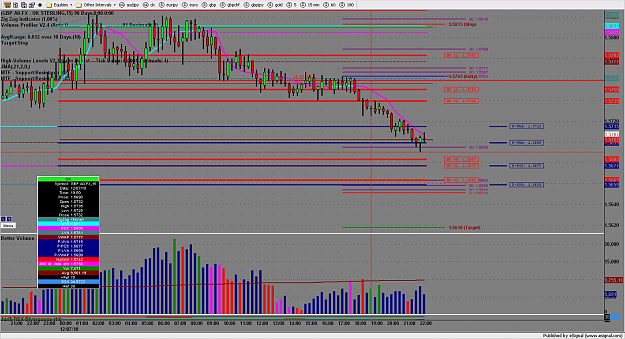
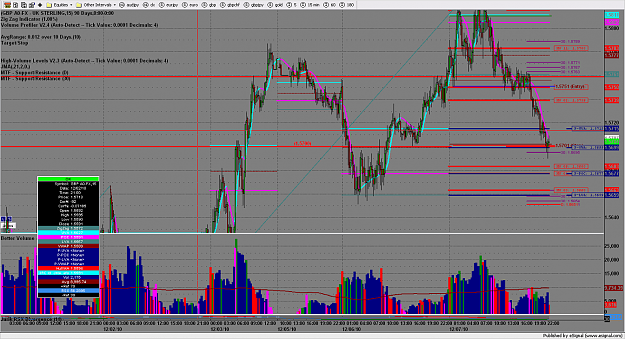
draw s/r lines from each pivot high / low on your charts and you will find targets and buy / sell areas
1.5700 is three things
1) whole number
2) support from dec 6th
3) resistance from dec 3rd
It is not that hard
If we break here .. guess what ...we do not go to 78.6 fib of 4 hour move ... we go to weekly support 1.5650 . That breaks we go to Dec 1 resis 1.5620 , then 1.5520. I think you get the picture. Computer algos do not give a shit about fibs .. all they care about is supply and demand areas
Check out gold today $10 down $5 up , that was symmetry... talk about auto traded.
Attached Image (click to enlarge)
Blogging daily now at www.volume.zone