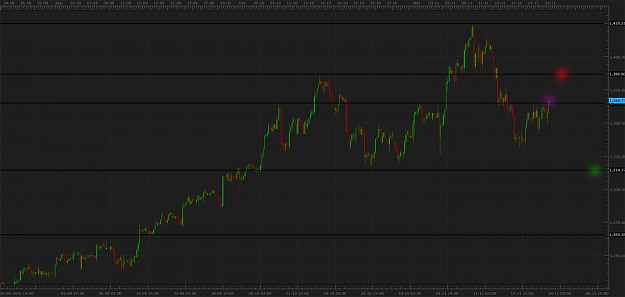
DislikedThe weekly chart looks good but the daily not so good until that 83.60 gets broken.Ignored
I agree the daily is starting to look a bit worn out.
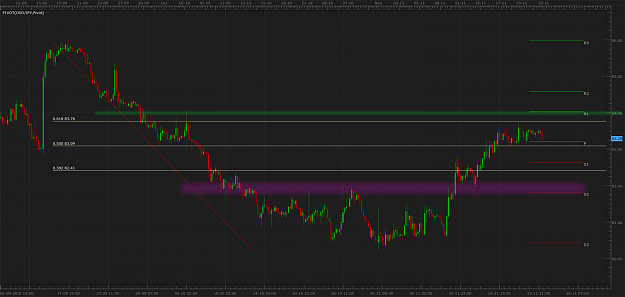
I have attached an hourly chart where we can see price touched the 0.618 Fib line perfectly.
If we see a dive back down to around 83.00 from here we may see a head and shoulders pattern complete with next support coming in around 82.50.
Could be a good opportunity to add to longs, but I would prefer to wait until 82.00 or for the weekly pivot S2 at around 81.82.
It will be interesting this week to see how traders play the Ireland story and will we see more Dollar buying on the fear of other European countries going the same route.
H1
Attached Image (click to enlarge)