DislikedNice chart again and very useful. I'd drawn something myself out of curiosity but yours adds a lot more to it so useful to see that.
As per an earlier post I made, I think news is going to be a big infulence this week not just because of the election, so I'm wondering if your lower target may hit short term but then after the election, who knows......
Again, excellent chart and great to see I was making some of the right lines finally
Also, thanks to Magix for good info a couple of days ago and a brilliant thread for us noobs!!Ignored
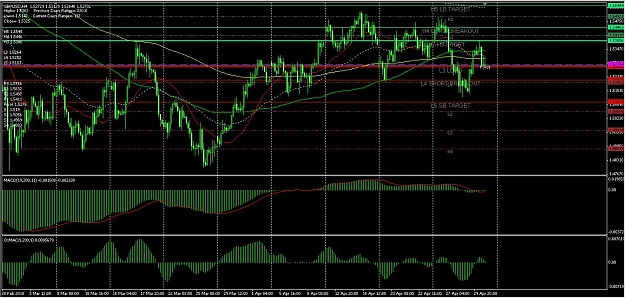
Here is a zoomed version of the same 4h chart.
Attached Image (click to enlarge)
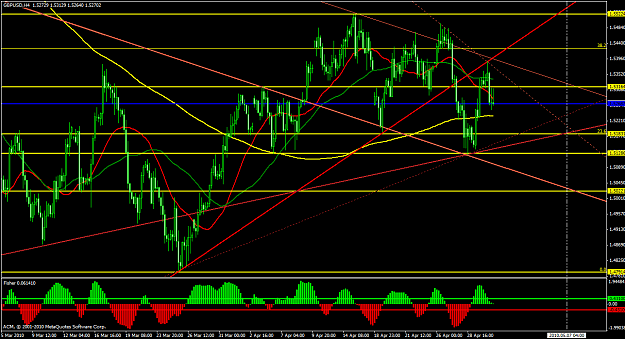
I am using this for my longer-term trades and is completely separate from the Voodoo Boodoo, which is more suited for scalping and shorter-term/day trading.
This chart also includes the Fisher Yur4ik indicator. This indicator is a simple version of the the Fisher Transform indicator which was devised by John Ehlers. I am using this as the main trend indicator of my long-term trading system. This means that you will first look at Fisher and if it is above the zero line you will be looking for buy signals and if it is below the zero line you will be looking for sell signals. I have added two lines at 0.431 above and below it, which indicate a stronger buy or sell signal. As soon it comes back to these lines you should close your positions after confirming with your charts (S/R and trendlines). I only use this on h1 and h4 timelines. I use the Voodoo Boodoo on lower timeframes.
Here is a ZIP file containing the indicator -
Attached File(s)
Enjoy the rest of your weekend and hope you get some greenies next week!