DislikedThanx Magix now understand a bit more where you comin from. Just as a note, if gu does go up to 1.54 area tomorrow that would tend to correlate with Eur/Gbp getting down to the cluster support range at .8650 ish area. I'm just wondering whether there might be a play going on to end the week at a high with a view to an extended rally back down next week. Am I over analysing, or do you concur with the thought process? Not asking you to advise, just wondering what your thoughts are.Ignored
The other correlating chart that I use is USDCAD, as it acts as an inverse pair. USDCAD is rapidly approaching a support on a weekly chart, I have posted it several pages ago, and have even made a few bones on the rise out of the ashes. Now that it seems to be heading back down towards its support, I am under the assumption that cable is on its way up.
To where?
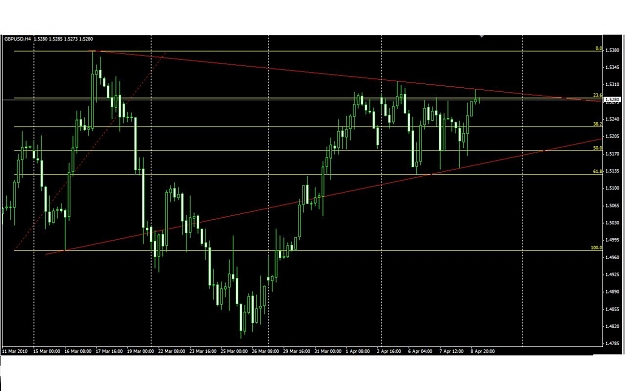
IF the correlation holds, we could see cable spike into its most recent highs on the daily chart of 1.5380 area and collapse, and if correlation breaks see Cable heading towards its daily resistance, currently 1.5786 <-200ema on daily chart.
I am on the side of bullish continuation but still cautiously watching for that weekly support to hold on UC. The inter day movements have offered some great opportunities, and when playing off the shorter time frames have been quite profitable.
That being said, I just really want out of this range and into something that might resemble a trend.
Money Can't Buy Happiness. Poverty Can't Buy SHIT! You Choose!