What you are doing is NOT price action it is simply S&R.
Price action IS candlestick patterns such a IB, OB, PB, etc.
Ignored
NO. S&R is simply support and resistance... notice how I say
at support or at resistance price breaks out... this is a combination or price action.. at support and resistance not support and resistance only.
candlestick patterns are produced from price action patterns but are not price action in themselves because they can be produced by price movement that is not a correct formation for that stick.. if all PB's(pin bars) where produced as a function of a price action pattern I guess u could consider them price action but they are not some are produced randomly... The question of what is price action has caused people who have asked what it is? and never have had it answered to refer to something that works as price action when it is not... Not saying the J16 doesnt work people have been doing what he does for a long time but it is not price action.
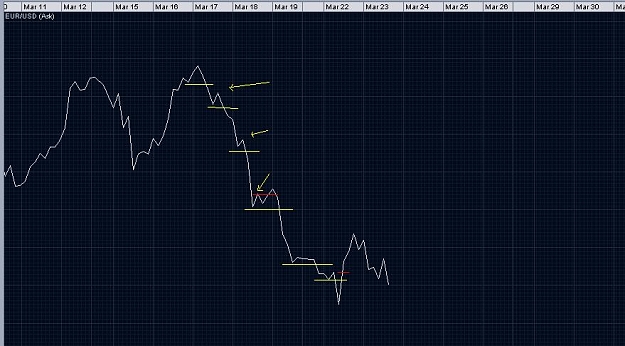
Price has broken low price must not break the failing lower highs to continue new trend
price has broken new low price must not break the failing lower highs to continue new trend
...etc
Price has broken new failing low and has taken us out of the trade as orders are building at the lower highs
price broke high triggered stop orders that where accumulating at highs
sellers entered the market and new selling orders where triggered at the low and orders begine to accumulate at high.
As price continues to break out we continue to enter as we take each trigger as price shows weakness or strength.
MM is built into price action because risk is limited and we control it... but adjusting stops when in profit and never adjusting stops more into loss... we chase price adding and accruing new orders as price trends.. this works like an anti-grid almost.. where people are accumulating losses we only accumulate into profit.
the honest answer about timeframes... this works on all time frames u can scalp price action until the cows come home... I say trade higher time frames because it give u
1. more time to react and prepare and read price action
2. the costs associated with the time frames decrease as u trade higher time frames..
3. more time to edit your orders and adjust them when they need to be adjusted.
I dont have fast hands and I am a slow thinker.. I also see that price does not move far enough and I pay to much of a spread to trade faster frames.. thus I dont trade them...
I do not believe in the arguement that lower time frames are noise just are not right for me.
|
Additional Username
|
Joined Mar 2010
|203 Posts
I agree with Domino for he uses pure price actions using line chart.
Sometimes I am disappointed when people talk about price actions
and use MA's, e.g. Stochastic for help - this is not price action.
I believe that candlesticks are kind of price actions considered on smaller time frames and i would call them 'price setups' and it is a huge science that must be discussed separately.
Price actions is when you use just a chart in different time frames and analyze it with SRs and channels and trendlines. That is all. You may use angles too.
Just let us not contaninate the science about price actions.
The last thing that I used before, was Volume indicator but now I prefer to
work only with charts.
now lets understand why PB's work look at this chart it is the same as the chart above.
notice how the places that orders stack up in the price action setups are at the break of the open of the PB look at the red line that was the stop out
you can not see the future of price where it is going or where it will be.. you can not trade where it has been.. you can only see what is currently happening.
orders accumulating at the pinbars high stop for people trading with trend.
youll also notice the orders accumulating on next bar of all the stops and triggers piling up on other time frames to power larger moves. notice how that is not at the pb low but in the future is raised.
now if the pin is in the right area at the right support in the right direction those stops are also accumulated with new order triggers and the addition and accumulation of all the orders make for more powerful moves.. with new highs within triggering distance we know that the trigger of the orders will push price to a new area that has a high chance of triggering new orders.
..J16 is not price action.. its candlestick trading.
Ignored
The correct application of Japanese Candlestick patterns INVOLVES an understanding of the price action prior to and or within the Japanese Candlestick occurs.
Most traders who fail with Japanese Candlesticks, fail because they don't focus on price action and instead believe it's only about pattern recognition.
Simply, your statement infers that Japanese Candlesticks and Price Action are mutually exclusive, they however are not. This is despite the fact that most learning sources for Japanese Candlestick analysis teach it as such.
Price is at Support...
Price created a failed new low and offers the potential to reverse...
Price has broken out...
Price must not take out the low for the reversal to hold...
Price makes another failed new low and a trend is forming off of support...
This new low must not be taken out for trend to hold...
..repeat until low off of resistance is taken out.
Risk Reward is market defined and is...
Ignored
There is more than one way to skin a cat........
I view price action only trading (no indicators) differently. Take a look at the chart below. This is an example of a Bearish Engulfing pattern (not the generic patterns found in books or most internet sites). From my perspective, what really brings this particular pattern to life is an understanding of what caused it. That is to say, the price action surrounding it.
I like volume. Although apparently one can not trade off of one timeframe or be a scalper and trade VSA, I use some of it in viewing price action. :
A. Wide Spread up candle on increased and climatic volume. Markets do not like high volume on up candles. Note that we closed well off the high of the candle. IF all the volume associated with this candle was buying, then the candle should not close of the high.
B. The next candle is up. This does not mean, however, that there was not hidden selling in the previous candle. Moreover, note that in this candle we again close well off the high. We close in the lower 1/3 of the range of this candle. The long upper shadow shows supply (selling) entering the market. This is an Up Thrust.
C. Bearish Engulfing dark candle. Whilst the volume is less than the previous two candles, it is nevertheless bearish. A+B+C all together create the valid bearish engulfing pattern. A alone is merely an candle line. As are B and C, but together they transform from independent candle lines (intervals) to a valid candle pattern.
D. Another candle with volume less than the previous two candles. But let's think about the context. We have seen supply enter on two up candles (close greater than the previous candle's close) and now we see an up candle with DECREASING volume. The Smart Money is not interested in higher prices at this time. In VSA parlance, this is No Demand.
VSAers can't take this trade because they need to look at 6 different timeframes and talk about background from 3 days ago. As a true price/volume action trader that incorporates Japanese Candlestick Patterns into the mix, the stage is set.
I believe this is how price action flows..........
Without VSA, you're playing checkers while the Smart Money plays chess.
The correct application of Japanese Candlestick patterns INVOLVES an understanding of the price action prior to and or within the Japanese Candlestick occurs.
Ignored
I can agree with this.. because u seperated price action from the candlestick anything in conjunction with S&R and Price action is enhanced.
Quote
Disliked
Most traders who fail with Japanese Candlesticks, fail because they don't focus on price action and instead believe it's only about pattern recognition.
agreed
Quote
Disliked
Simply, your statement infers that Japanese Candlesticks and Price Action are mutually exclusive, they however are not. This is despite the fact that most learning sources for Japanese Candlestick analysis teach it as such.
no it does not.. I am just seperating them.. japanese candlesticks are not price action just like how u seperated them above.. needing price action surrounding them to understand them.
Quote
Disliked
There is more than one way to skin a cat........
I view price action only trading (no indicators) differently. Take a look at the chart below. This is an example of a Bearish Engulfing pattern (not the generic patterns found in books or most internet sites). From my perspective, what really brings this particular pattern to life is an understanding of what caused it. That is to say, the price action surrounding it.
ill agree
Quote
Disliked
I like volume. Although apparently one can not trade off of one timeframe or be a scalper and trade VSA, I use some of it in viewing price action. :
A. Wide Spread up candle on increased and climatic volume. Markets do not like high volume on up candles. Note that we closed well off the high of the candle. IF all the volume associated with this candle was buying, then the candle should not close of the high.
I do enjoy trying to understand the volume assisted market profile. but is beyond this thread and would probably need another to be discused.
Quote
Disliked
B. The next candle is up. This does not mean, however, that there was not hidden selling in the previous candle. Moreover, note that in this candle we again close well off the high. We close in the lower 1/3 of the range of this candle. The long upper shadow shows supply (selling) entering the market. This is an Up Thrust.
C. Bearish Engulfing dark candle. Whilst the volume is less than the previous two candles, it is nevertheless bearish. A+B+C all together create the valid bearish engulfing pattern. A alone is merely an candle...
volume in spot is not usable as it is splotchy at best. but it is best used in realizing s&R which is beyond this thread. we are looking at cold hard PA at S&R.. I can agree with you that volume assisted market profile has its merrit but not so much in spot markets... but as you stated yourself Candlesticks are not PA and understanding the PA around candlesticks it what makes it work.
Joined Aug 2009
|
Status: Reading the TAPE
|2,389 Posts
You misunderstand. Price Action and Japanse Candlesticks are not separate.
You can take the miopic view a candle pattern, like a hammer. But those that simply trade hammers will fail because they do not look at the context inwhich the hammer was formed-the price action.
Also no mention of Market Profile was made by me. Volume is not market profile.
Without VSA, you're playing checkers while the Smart Money plays chess.
You misunderstand. Price Action and Japanse Candlesticks are not separate.
You can take the miopic view a candle pattern, like a hammer. But those that simply trade hammers will fail because they do not look at the context inwhich the hammer was formed-the price action.
Also no mention of Market Profile was made by me. Volume is not market profile.
Ignored
ok how do I misunderstand you.. you say.. candlesticks and price action are not seperate... then you say those who trade hammers wil fail because the do not look at the context in which its formed aka the "price action"
so your saying you can trade hammers but you will fail unless u look at the price action surrounding the hammer..
you are saying that.. there is a hammer... but that hammer does not mean trade I must look at something else.. that something else is the price action
thus hammer and price action are seperate.
because you must look at each.. you are saying you can trade the hammer as long as the price action confirms the hammer. and not trade it if it does not..
So lets add something else.. since hammer is candle stick and outside bar and inside bar are also candlesticks.. then we can exchange them and say
if the inside bar is not confirmed by the price action then we do not trade
if the outside bar is not confirmed by the price action then we do not trade
if the pinbar is not confirmed by the price action then we do not trade.
thus and bar can form and as anybar that forms is a candlestick and bar that forms as long as price action confirms it is thus a buy signal and not price action because the price action is the context or senario surrounding the bar...
am I close.?... thus price action and candlesticks are seperate... and candlesticks need confirmation from price action to be adequate... not saying they cant be trading together only candlesticks are not price action.
which leads us to the question of what is the price action surrounding the candlestick..
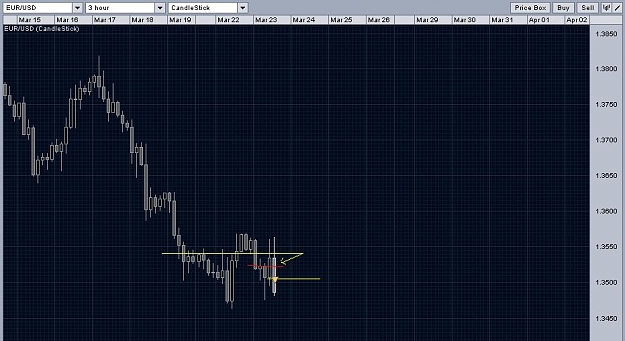
price has broken out stops and new long triggers are piling up against failed lower high....
we price our stop at this area and move to breakeven
we also sell the new break and adjust.
this is price action.
im in the midst of trying to learn all this candle stick "pa" via strat, j16, and jackos thread. iv always been more interested in line charts so im very interested in this. please continue teaching!
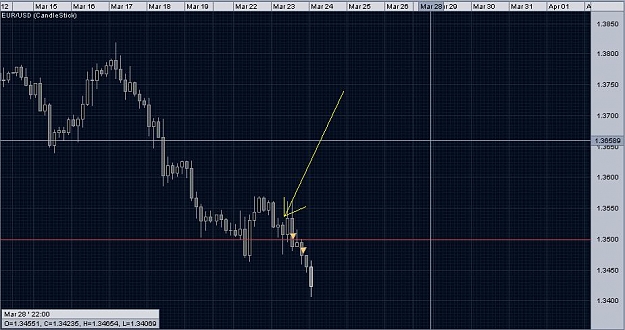
price is continuing to break out thus Im still holding the trade.. no ifs or maybes.. I am selling because price action brokeout lows.
here is effect of trade above...
Risk:reward is 1:5 right now....
but price action will tell me when to exit and that is not now
Ignored
So what you are saying here is that, PA will tell you when to either add to this trade or close it. What is that PA going to be? Another support area and price breaking through it, then retracing, telling us that the former support area has now become resistance to price breaking above it?
If it is, then that is certainly not price action, it is just a PPZ area.
PB and other real PA work because they are multi time frame, a PB on H4 could be a head and shoulders pattern on H1 and other patters on other TF.
This gets the attention of more people, and that is why they work.
So what you are saying here is that, PA will tell you when to either add to this trade or close it.
Ignored
thats the idea.. if you can whip out your crystal ball and tell me exactly where price will turn be my guest... cause I sure dont know anyone who can.
Quote
Disliked
What is that PA going to be? Another support area and price breaking through it, then retracing, telling us that the former support area has now become resistance to price breaking above it?
If it is, then that is certainly not price action, it is just a PPZ area.
I do not think you understand the concept... your candlesticks are a by product of price action not price action itself.. now im not sure about your PPZ zone im assuming you guys gave support and resistance a fancy name.. and all I have to say about that is you can put a dress and lipstick on a pig but at the end of a day its still just one fancy looking pig....
your S&R is not just breaking or holding here we are waiting for price to reach a S&R zone .. or your fancy dress and lipstick wearing PPZ... and then show its hand ... we do not place targets because we do not expect the future to be predictable.. thus there is no need to set a target. we are simply skewing a distribution... and so infinite yield with limited loss produces positive profits.
your argument just another s&R area breaking... no its not.. its price reaching S&R and watching the price action or the shorter term waves price will show you only what it is doing not what it will do down the road.
Quote
Disliked
PB and other real PA work because they are multi time frame, a PB on H4 could be a head and shoulders pattern on H1 and other patters on other TF.
This gets the attention of more people, and that is why they work.
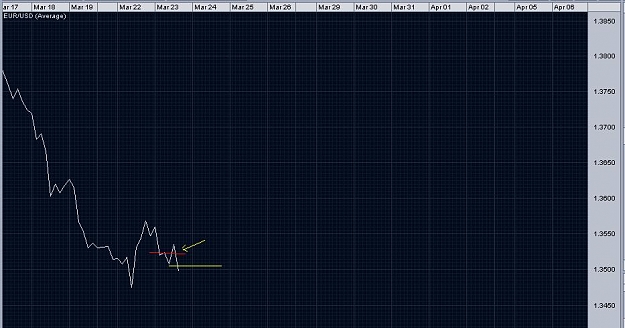
actually no your wrong. PB and other "real PA" that you state works because of the building of the Order flow on the chart.. stacking and concentration of orders powers moves.
so I guess you coulda gone long when we went short because of this PB.. not read the order flow and be stopped out...
but 1000$ dollars on a PF later.. youll just tell me its not a A+++ grade pinbar which is completely subjective and has no way of being quantified.
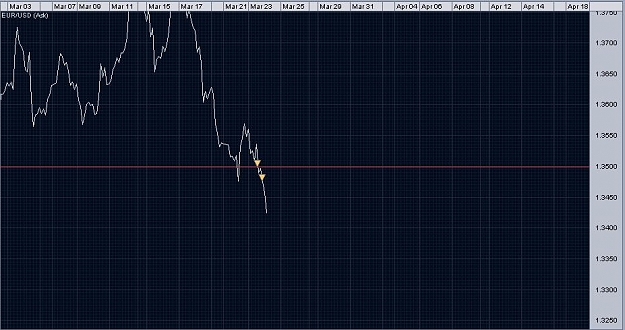
and if you cant find the failed PB in the apparent short order flow I put a big yellow arrow there for you.
Can you explain why you sell?
What if break will appear to be busted.?
Ignored
I sell because price is breaking lower...
.. if price appears to be busted..
im assuming price looks stalled... I wait.. it will wave and break a high and take me out.
anyways I feel like Ive completely hijacked this thread... so ill stop for a bit.