• Home
  • Forums
  • Trades
  • News
  • Calendar
  • Market
  • Brokers
  • Login
  • Join
  • User/Email: Password:
  • 8:29pm
Menu
  • Forums
  • Trades
  • News
  • Calendar
  • Market
  • Brokers
  • Login
  • Join
  • 8:29pm
Sister Sites
  • Metals Mine
  • Energy EXCH
  • Crypto Craft

Options

Bookmark Thread

First Page First Unread Last Page Last Post

Print Thread

Similar Threads

Simplified Chaos Trading 23 replies

Simplified original turtle trading system 42 replies

Simplified Trailing Stop 0 replies

Simplified Version Of (Fast) Stochastic 2 replies

a software that can offer a simplified rate of any currency in your screen 0 replies

  • Trading Discussion
  • /
  • Reply to Thread
  • Subscribe
  • 112
Attachments: Support and Resistance Trading Simplified
Exit Attachments

Support and Resistance Trading Simplified

  • Last Post
  •  
  • Page 1 23456 13
  • Page 1 234 13
  •  
  • Post #1
  • Quote
  • First Post: Feb 6, 2010 1:10pm Feb 6, 2010 1:10pm
  •  Guerrillawar
  • | Joined May 2008 | Status: Member | 466 Posts
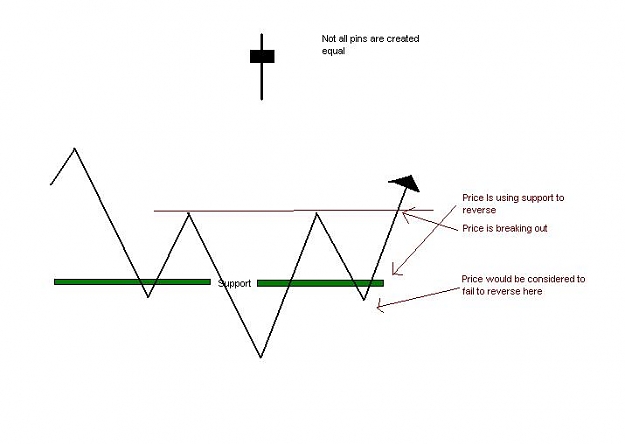
The purpose of this thread is to simplify support and resistance style trading so a trader can quickly scan the market and make informed decsisons with out letting biases enter into the equation.

If you don't understand S&R trading go to BRV's No Brainer thread. This is a great place to learn about S&R. Everything Steve has written in that thread is well worth reading. He is one of the rare few at FF who is a true professional.

Everyone is welcome here to discuss pure price action. Ideally I don't want any charts that are unreadable. We wish to discuss pure price action. Absolutely no indicators on the chart. Fibs, MA's, trendlines and pivots is it. However I would prefer if even that would be omitted because it can distract from price action.

Again everyone is welcome here to discuss pure price action.

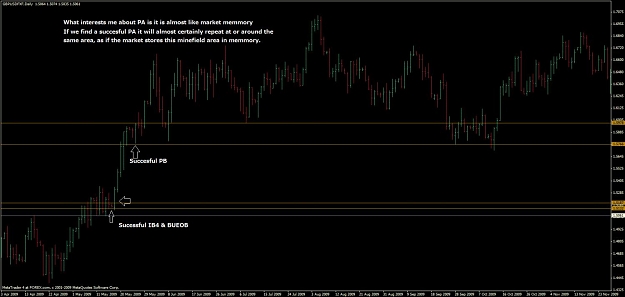
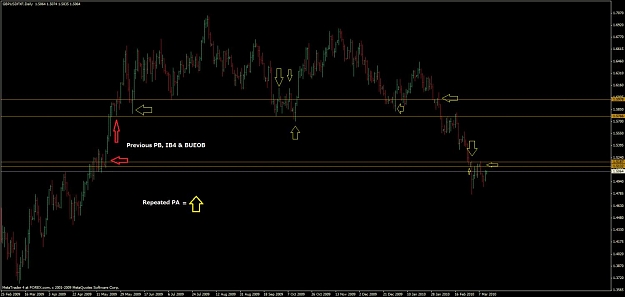
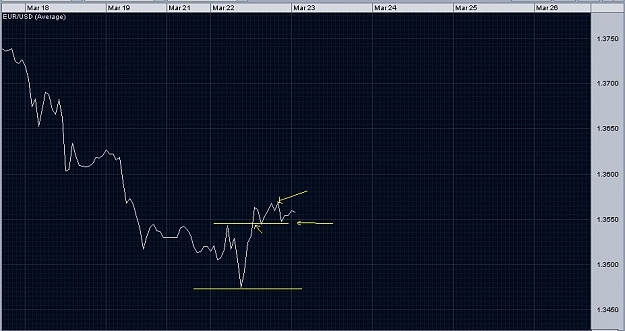
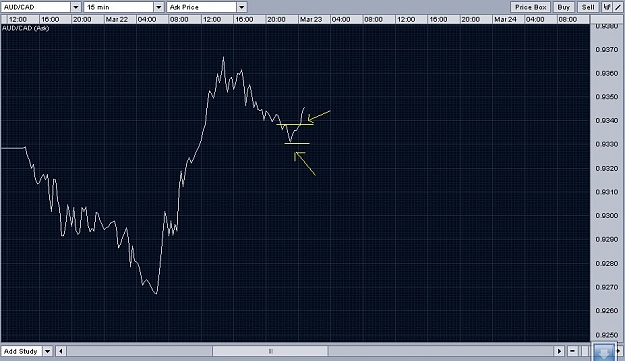
Here are some charts of Fridays price action.
Attached Images (click to enlarge)
Click to Enlarge

Name: eurusd.gif
Size: 12 KB Click to Enlarge

Name: audusd.gif
Size: 12 KB Click to Enlarge

Name: usdchf.gif
Size: 14 KB Click to Enlarge

Name: eurjpy.gif
Size: 12 KB
Click to Enlarge

Name: audjpy.gif
Size: 12 KB Click to Enlarge

Name: oil.gif
Size: 11 KB
  • Post #2
  • Quote
  • Feb 7, 2010 2:04am Feb 7, 2010 2:04am
  •  TheArcher
  • | Joined Jun 2008 | Status: Member | 2,013 Posts
what is "price action" ?

this is not a trick question ... i don't know hence i ask
 
 
  • Post #3
  • Quote
  • Feb 7, 2010 7:17pm Feb 7, 2010 7:17pm
  •  Guerrillawar
  • | Joined May 2008 | Status: Member | 466 Posts
Live trade long eurusd
50 pip stop
100 pip target
Attached Image (click to enlarge)
Click to Enlarge

Name: eurusd.gif
Size: 12 KB
 
 
  • Post #4
  • Quote
  • Feb 8, 2010 5:53pm Feb 8, 2010 5:53pm
  •  Kyle_Vee
  • | Joined Jan 2010 | Status: Member | 63 Posts
Hi Guerrillawar,

A few weeks ago i decided to build my trading strategy around S/R as it just makes sense logically to me. But i am still learning how to do it correctly, at the moment im focusing on "flip areas" where price has touched multiple times on the top and bottom. But i am struggling with the rest, when it is important s/r or not so important etc.

But i look forward to following this thread and hopefully learning more.

I noticed you are using 5m charts, do you feel it is reliable enough?
And how long have you been trading profitable using this?

Thanks.
Fxcrafter All Time Return: na
 
 
  • Post #5
  • Quote
  • Mar 11, 2010 8:03pm Mar 11, 2010 8:03pm
  •  Mindsphere
  • | Joined Jul 2009 | Status: Member | 412 Posts
Thanks for starting this thread! I was actually going to post this in the NBT thread, but seeing as you've started a thread of your own this is probably the ideal place to address it.

Quoting Guerrillawar
Disliked
Nothing on the chart tells me to place a pending order to sell. However, I would carefully watch price action as soon as those levels mentioned are hit. If there is a way to place a trade with minimal risk that lines up with the immediate condition of the market and order flow place a trade. Its not wise to say that a fib number has special meaning and is going to cause the market to reverse right away.
Ignored
I've read a lot of what BRV has written both in the pdf and on his website, however the most he seems to say is to look at the "momentum" of the price movement. i.e. the strength of the moves into the S/R zones. The core idea seems to be that a slower move is more likely to bounce and a faster one more likely to break through. There are of course other things like candlestick formations and so on which one can keep an eye on in respect to price action, however many of these are contentious.

I'm wondering if you can shed some light as to what you look for when attempting to read price action and, more specifically, what is your approach to understanding order flow?
 
 
  • Post #6
  • Quote
  • Mar 11, 2010 9:17pm Mar 11, 2010 9:17pm
  •  Rhodes1
  • | Joined Oct 2009 | Status: Member | 5 Posts
This is the thread ive been looking for. Im a new trader and I am avoiding any "systems" and "holy grails" like the plague. I want to learn price action and Support and Resistance. I have a feeling that with just that indicator I can trade successfully and consistently. I dont want to get trapped into systems and indicators as from what I have read theres never anything that works 100% long term.
 
 
  • Post #7
  • Quote
  • Mar 11, 2010 11:54pm Mar 11, 2010 11:54pm
  •  domino
  • Joined Apr 2009 | Status: Member | 1,438 Posts
Quoting TheArcher
Disliked
what is "price action" ?

this is not a trick question ... i don't know hence i ask
Ignored
the action of price
 
 
  • Post #8
  • Quote
  • Mar 12, 2010 12:32am Mar 12, 2010 12:32am
  •  robshan
  • | Joined Sep 2009 | Status: Member | 9 Posts
Nial Fuller is someone worth checking out too if you're interested in price action trading

youtube.com/oztrader

Personally, I only trade price action ... the only thing that I have on my charts are lines and candles ...... no indicators, no oscillators

Cheers,

PipperySlipples
 
 
  • Post #9
  • Quote
  • Edited at 1:29am Mar 12, 2010 12:33am | Edited at 1:29am
  •  Rastaman
  • Joined Sep 2008 | Status: Member | 2,298 Posts
Good thread. Keep it up.

EDIT: Seeing as how you are discussing price action, don't you really need to show the candles or PA can not be observed, only S&R can be seen.
Attached Images (click to enlarge)
Click to Enlarge

Name: gu d1.jpg
Size: 85 KB Click to Enlarge

Name: zo.jpg
Size: 75 KB
Starting to see instead of just looking.
 
 
  • Post #10
  • Quote
  • Mar 12, 2010 1:11am Mar 12, 2010 1:11am
  •  robshan
  • | Joined Sep 2009 | Status: Member | 9 Posts
Quoting Rastaman
Disliked
Good thread. Keep it up.

EDIT: Seeing as how you are discussing price action, you really need to show the candles or PA can not be observed, only S&R can be seen.
Ignored

I agree ... Price action is all about the current market sentiment and momentum .... this is best shown through candles or at the very least bar graphs if you can read them properly ... line charts can show the overall movement and levels but not current "price action"
 
 
  • Post #11
  • Quote
  • Mar 18, 2010 1:53am Mar 18, 2010 1:53am
  •  MarketPips
  • | Additional Username | Joined Mar 2010 | 203 Posts
Quoting Guerrillawar
Disliked
Everyone is welcome here to discuss pure price action. Ideally I don't want any charts that are unreadable. We wish to discuss pure price action. Absolutely no indicators on the chart. Fibs, MA's, trendlines and pivots is it.
Ignored
Of course this is your thread but using MA's does not belong to pure price action. Moreover, MA's are for beginners.
I would propose as improvement not to use like MN1, W1 but just M5, M15.
Also, anybody can analyse anything on the left side. What about analyzing what is to happen on the right side of the chart, that would be interesting.
 
 
  • Post #12
  • Quote
  • Mar 21, 2010 11:57pm Mar 21, 2010 11:57pm
  •  Rastaman
  • Joined Sep 2008 | Status: Member | 2,298 Posts
Quoting MarketPips
Disliked
Of course this is your thread but using MA's does not belong to pure price action. Moreover, MA's are for beginners.
I would propose as improvement not to use like MN1, W1 but just M5, M15.
Also, anybody can analyse anything on the left side. What about analyzing what is to happen on the right side of the chart, that would be interesting.
Ignored
Better tell that to Jim of James 16. He uses MA's in his system.
Starting to see instead of just looking.
 
 
  • Post #13
  • Quote
  • Mar 22, 2010 12:12am Mar 22, 2010 12:12am
  •  MarketPips
  • | Additional Username | Joined Mar 2010 | 203 Posts
I am aware that the author of the thread wants valuable inputs.
I think that that minor inputs can be of not bad importance.
Big swings are not necessary strong SRs. When swings are
a bigs moves supported by big move with small Volume are of big importance for me.
 
 
  • Post #14
  • Quote
  • Mar 22, 2010 12:51pm Mar 22, 2010 12:51pm
  •  FXTradeX6
  • | Joined Sep 2006 | Status: Member | 57 Posts
Quoting TheArcher
Disliked
what is "price action" ?

this is not a trick question ... i don't know hence i ask
Ignored
Check out the James16 thread in the commerical forum. Price action = Price Patterns
 
 
  • Post #15
  • Quote
  • Mar 22, 2010 1:45pm Mar 22, 2010 1:45pm
  •  domino
  • Joined Apr 2009 | Status: Member | 1,438 Posts
Quoting FXTradeX6
Disliked
Check out the James16 thread in the commerical forum. Price action = Price Patterns
Ignored
J16 is not price action.. its candlestick trading.
 
 
  • Post #16
  • Quote
  • Mar 22, 2010 5:46pm Mar 22, 2010 5:46pm
  •  domino
  • Joined Apr 2009 | Status: Member | 1,438 Posts
here this is price action

the waves really make price action

not the fact a pin bars high gets taken out...

Price action trading flows like this

Price is at Support...
Price created a failed new low and offers the potential to reverse...
Price has broken out...
Price must not take out the low for the reversal to hold...
Price makes another failed new low and a trend is forming off of support...
This new low must not be taken out for trend to hold...
..repeat until low off of resistance is taken out.

Risk Reward is market defined and is not user defined.
Attached Image (click to enlarge)
Click to Enlarge

Name: price action.JPG
Size: 21 KB
 
 
  • Post #17
  • Quote
  • Mar 22, 2010 5:53pm Mar 22, 2010 5:53pm
  •  domino
  • Joined Apr 2009 | Status: Member | 1,438 Posts
the Concepts of "Order Flow" are built into price action.

Order Flow....

As new higher lows are created Orders will stack at the breaks of the lows due to traders looking long placing stops.. and traders looking short placing sell orders... as trend progresses stops are moved and new traders enter the trend to drive it... thus new orders continue to pile against the lows.

Once more sellers enter the market and overwhelm the buyers the low is broken and the exits.. and new sell entry orders are triggered driving price and building selling momentum.. and orders begin to stack against the highs.

In a longer term uptrend we watch price pull against the main trend ... and more orders pile against the highs as traders know that the trend is long... they wait for the selling to fade before overwhelming with buy orders.. when price breaks out with trend the order flow and price action drive the entrance of new traders and "show" momentum

anyways this is very basic price action understanding... not a specific candle has formed against support... that is candlestick trading and as such is price action so watered down its not much price action.
 
 
  • Post #18
  • Quote
  • Mar 23, 2010 12:30am Mar 23, 2010 12:30am
  •  domino
  • Joined Apr 2009 | Status: Member | 1,438 Posts
Price has broken out
Price has created new higher lows
Price must not break new higher lows to maintain newly forming trend...
Price may breka new highs and encourage more buying in orderflow we know orders are above
If price breaks new lows it will trigger new stop orders and entrance triggers in orderflow so to protect capital we place stop at levels.
Attached Image (click to enlarge)
Click to Enlarge

Name: pa1.JPG
Size: 65 KB
 
 
  • Post #19
  • Quote
  • Mar 23, 2010 12:42am Mar 23, 2010 12:42am
  •  domino
  • Joined Apr 2009 | Status: Member | 1,438 Posts
as right now

audcad

Price has brokenout
Price is rising the order flow stops have been hit and entry triggers have executed.
Price must not break low in function to form a new trend light stop orders are forming at new low and not enough attractor.
Price must form a new failed higher low and breakout to secure trend and traders to add and raise stops to the new higher level
Attached Image (click to enlarge)
Click to Enlarge

Name: pa2.JPG
Size: 83 KB
 
 
  • Post #20
  • Quote
  • Mar 23, 2010 12:52am Mar 23, 2010 12:52am
  •  domino
  • Joined Apr 2009 | Status: Member | 1,438 Posts
as you trade a price action strategy you should hear the tone of the trade.

Price has broken...
Price must...
price is continuing to...

Not..

Price may break around...
It should continue like this for ....
this setup fails in X pips..

Price action is definative... it is what is happening not what may happen.
 
 
  • Trading Discussion
  • /
  • Support and Resistance Trading Simplified
  • Reply to Thread
    • Page 1 23456 13
    • Page 1 234 13
0 traders viewing now
  • More
Top of Page
Forex Factory Blog Updated: Alerting All Members
  • Facebook
  • Twitter
About FF
  • Mission
  • Products
  • User Guide
  • Media Kit
  • Blog
  • Contact
FF Products
  • Forums
  • Trades
  • Calendar
  • News
  • Market
  • Brokers
  • Trade Explorer
FF Website
  • Homepage
  • Search
  • Members
  • Report a Bug
Follow FF
  • Facebook
  • Twitter

FF Sister Sites:

  • Metals Mine
  • Energy EXCH
  • Crypto Craft

Forex Factory® is a brand of Fair Economy, Inc.

Terms of Service / ©2022