1. Horizontal S/R levels at a round number 2. 50% retracement at the closest round number 4. Touch of diagonal trendline at the closest round number 5. Bar formation at the above
Ignored
Thanks, Dan - that's really helpful. I've always been interested in Jacko's approach, but somehow couldn't quite grasp its 'simplicity'! You've straightened it out for me, while adding your own slant.
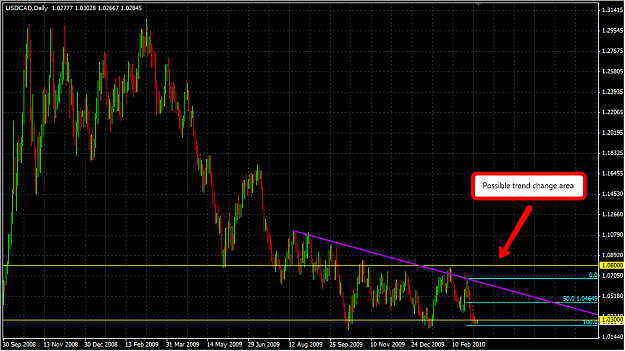
I don't have a trigger at the moment but my general outlook is bearish unless the upper areas of resistance get broken, as per the attached chart. The long term trend is down and therefore my outlook will remain that way until a change of trend is proven.
I am a new member to this forum, but have spent several hours (over 200 hours) getting up to speed! My background is in banking, but not forex - so it has been a steep learning curve!
I went short USD/JPY yesterday at 90.61 (Fib 61.8% retracement, daily) because the weekly trend is down. Would you have agreed with this?
Also, AUD/USD seems to be coming to the end of the ABC correction (Elliott, weekly). What price would you go short on this pair? What s/r would you look at for this pair, if you agree with me that this will be a long term short?
Thank you for all your comments and advice. I have been following "Jacko", The Real Thing, Peter Crowns, J12 and of course your forum.
The jury is out for me on the Peter Crowns Dib method (inside bar). However, do you think this method is a play around s and r following the long term trend? Another tool or indicator perhaps? Would really appreciate your feedback.
I should also add that I am short G/U from 1.5150 and short E/U from 1.3650.
Ignored
I am short too. Dan, how do you manage ur stops? Do you have some kind of alarm to warn that the price is hovering near your target point and it is time to move the stops?
I should also add that I am short G/U from 1.5150 and short E/U from 1.3650.
Ignored
I am watching the 1.35/45 area (Eur/Usd) as a possible s/r. Is this sensible, in light of the fact a stronger s/r lies below around 1.3464? I would really appreciate your thoughts. I am a fast learner, so should not take long to get up to speed.
My gut feeling is EUR wants to go higher in the short term (1.38 approx.) before resuming medium term downtrend to 1.10 by end of year. Would you agree with this?
Also, with USD/CAD, would you agree short term USD is higher on daily, not lower, as I have heard expressed above?
I know I am posting a lot. May I ask you your view on the commodity stocks (e.g. BHP, Vedanta, Rio, Lonmin, Xstrata). If you believe the commodities peaked last year (a contrarian view) would you be looking to go short on these imminently. If you look at the charts for all these stocks over a two year period, it looks like a classic ABC pattern correction similar to EUR/USD. If this is correct, wave 3 down (the steepest wave, Elliott) should commence soon. This would also tie in with a strong dollar.
Of course, I could be wrong! We should know within the next six months!!
I am a new member to this forum, but have spent several hours (over 200 hours) getting up to speed! My background is in banking, but not forex - so it has been a steep learning curve!
I went short USD/JPY yesterday at 90.61 (Fib 61.8% retracement, daily) because the weekly trend is down. Would you have agreed with this?
Also, AUD/USD seems to be coming to the end of the ABC correction (Elliott, weekly). What price would you go short on this pair? What s/r would you look at for this pair, if you agree with me that this will be a long...
Ignored
Hi,
Thanks for your post. I would certainly agree with your trade on U/J - in fact you got in at a better price than me - I took a short at 90 as price came down today. The trade is sitting at +20 at the moment but has stalled a bit!
With regards to A/U - no I would not be looking to short at the moment. Although I take note of potential developments that could cause a change of trend I will not trade them until proven. That does mean I miss the tops and bottoms of these moves but that is fine; I prefer to take my trades from the developed trend with low risk entries rather than with higher risk trend reversal entries.
I don't trade the dibs method myself but I have read through it and studied the method. Just like any other chart pattern (i.e. pin bars, engulfing patterns) inside bars are useless on their own but when you combine it with support/resistance levels, trend retracements etc they become another valuable tool to add to your toolbox.
It sounds like you are following the price action path rather than the indicator path so I reckon you are on the way to working this out!
I am short too. Dan, how do you manage ur stops? Do you have some kind of alarm to warn that the price is hovering near your target point and it is time to move the stops?
Ignored
Most of the time I have access to my computer so I can keep an eye on developments periodically. However, if I am particularly busy or not in the office I will use a text alert service to tell me when price has reached a "target point".
I am watching the 1.35/45 area (Eur/Usd) as a possible s/r. Is this sensible, in light of the fact a stronger s/r lies below around 1.3464? I would really appreciate your thoughts. I am a fast learner, so should not take long to get up to speed.
My gut feeling is EUR wants to go higher in the short term (1.38 approx.) before resuming medium term downtrend to 1.10 by end of year. Would you agree with this?
Also, with USD/CAD, would you agree short term USD is higher on daily, not lower, as I have heard expressed above?
Thank you for your comments....
Ignored
Well, as I have a short on E/U already I am looking for more downward movement lol!! If price broke up beyond 1.3700 I would agree that the 1.3800/50 area would be the next place to look for a short entry.
I'm not sure what you mean with the U/CAD question - do you mean you are expecting prices to go higher? In which case I would agree that in the short term that is a definite possibility. However, my long term view remains bearish until the upper resistance (shown in a previous chart) is broken.
I know I am posting a lot. May I ask you your view on the commodity stocks (e.g. BHP, Vedanta, Rio, Lonmin, Xstrata). If you believe the commodities peaked last year (a contrarian view) would you be looking to go short on these imminently. If you look at the charts for all these stocks over a two year period, it looks like a classic ABC pattern correction similar to EUR/USD. If this is correct, wave 3 down (the steepest wave, Elliott) should commence soon. This would also tie in with a strong dollar.
Of course, I could be wrong! We should...
Ignored
Hi,
So long as the technicals (support & resistance, trendlines etc) support that view then I would. As mentioned earlier, although I take notice of fundamental changes etc I only trade them once my chart supports that change.
I don't follow Elliot Wave myself as it is a bit too complicated for my liking but I appreciate your view on this!
Well, as I have a short on E/U already I am looking for more downward movement lol!! If price broke up beyond 1.3700 I would agree that the 1.3800/50 area would be the next place to look for a short entry.
I'm not sure what you mean with the U/CAD question - do you mean you are expecting prices to go higher? In which case I would agree that in the short term that is a definite possibility. However, my long term view remains bearish until the upper resistance (shown in a previous chart) is broken.
Regards,
Dan
Ignored
Thank you for your timely replies. I really do appreciate your comments.
I was wondering whether you would ever pick an s/r around 1.3545, if you didn't have a trade on it. I saw some support around here and wondered if you thought the same. I am trying to learn this method and felt this price might have some support (in light of the last few day's charts). If not, please could you direct me to the best information source on this subject and I will study it. Am I right in stating that the three best methods are s/r, fib and then price indicator - or should I be adding another tool before price indicators (e.g. subjective trend lines)? Also, when an s/r has been hit, what price indicators (or any other indicators) do you look at? I suppose I am asking what price indicators (or other tools) you would accept as having the strongest probability of an entry level.
I know you have probably spelt this out one hundred times before, so I will give back at some point to show my upmost good faith.
Yes, I was indicating U/CAD to go up in the very short term.
Thank you again Dan for your time on this subject.
Thank you for your timely replies. I really do appreciate your comments.
I was wondering whether you would ever pick an s/r around 1.3545, if you didn't have a trade on it. I saw some support around here and wondered if you thought the same. I am trying to learn this method and felt this price might have some support (in light of the last few day's charts). If not, please could you direct me to the best information source on this subject and I will study it. Am I right in stating that the three best methods are s/r, fib and then price indicator...
Ignored
No response so went long at 3545 with target 3592 (fib retracement). It hit target - all out for 47 pips. Close call! Would still like to know if I should have used s/r at around 3545 or waited to lower s/r at around 3450. Would be grateful for any advice.
5 Minute chart (I know, not a good long term indicator - just a quick scalp).
At GMT 15.05 looking to take trade - long liar nose. Used fib (50%) to exit trade at 278 (drew fib from 311 to 248 - 5 minute chart).
I am trying to take a disciplined approach to Dan's method. Am I right in thinking he only takes 50% Fibs with whole numbers and much larger time frames to draw s and r lines? I would like to understand his timeframes, entry points and how (and where) he draws his s and r lines. What price action indicators does he use, once a support or resistance area is being hit? Perhaps, this is simple to everyone else, but I am new to this.
Personally, I try to use long term charts to track the trends. Then I use fibs on these long term charts to indicate fundamental points of change and therefore entry and exit points. I have spent a considerable amount (over 1000 hours) of time looking at charts and formulating interesting set ups from price action. I have recently looked into shorter time frames in order to try to profit from range bound currencies. As I am new to this, I was hoping for a little bit of guidance. I can take hints, so no need to spell everything out. I don't believe in learning without putting money down and so I have started from scratch trading real money - it focuses the thinking. Thankfully, I have not lost yet, but know it is only a matter of time even with the right method, money management and discipline (and playing the right probabilities) - the reason I decided to try to learn (with respect) from others. I am looking for simple, not complicated as I do not believe the market IS complicated. I was hoping for a skeleton approach in which to build upon. Then, I will post my strategy and results. I do not believe in taking a selfish view - most of us are not "big fish" but are enthusiastic to learn this trade.
I was hoping to gain a better understanding of s and r lines and how people use these areas to formulate their entry points to the highest degree of accuracy. Perhaps, I am hoping for too much. If anyone has a guide or brief outline of how to do this, I would appreciate it.
I have printed off hundreds of ideas from this forum, but I really do believe that there is something in this trend analogy.
No response so went long at 3545 with target 3592 (fib retracement). It hit target - all out for 47 pips. Close call! Would still like to know if I should have used s/r at around 3545 or waited to lower s/r at around 3450. Would be grateful for any advice.
Ignored
Hi Knight Rider,
Personally I wouldn't have taken that trade or any other long on EU at the moment. I only trade in the direction of the trend which is currently down. I'm not saying you were wrong to do so (as you made it work) but it's not in my comfort zone!
Am I right in stating that the three best methods are s/r, fib and then price indicator - or should I be adding another tool before price indicators (e.g. subjective trend lines)? Also, when an s/r has been hit, what price indicators (or any other indicators) do you look at? I suppose I am asking what price indicators (or other tools) you would accept as having the strongest probability of an entry level.
Ignored
When you say "price indicator" are you referring to candlestick patterns (shooting starts, engulfing patterns etc) or do you mean something else?
Horizontal support and resistance levels are the key to the market. You can trade them using different methods - my method is to use trendlines and the 50% retracement to guide me to possible s/r levels that are likely to provide an entry back into the trend.
Dan, you mentioned you went short at EU at 1.3650. I could find no compelling reasons to short there. did you do so based on trendline and switched to H1 tf yo see if prices were losing upward momentum?
appreciate yr comments there.
thanks
Dan, you mentioned you went short at EU at 1.3650. I could find no compelling reasons to short there. did you do so based on trendline and switched to H1 tf yo see if prices were losing upward momentum?
appreciate yr comments there.
thanks
Ignored
Hi herzog21,
You are partly right - I did drop down to the H1 to watch for an entry. But my reasons for entering are as follows:
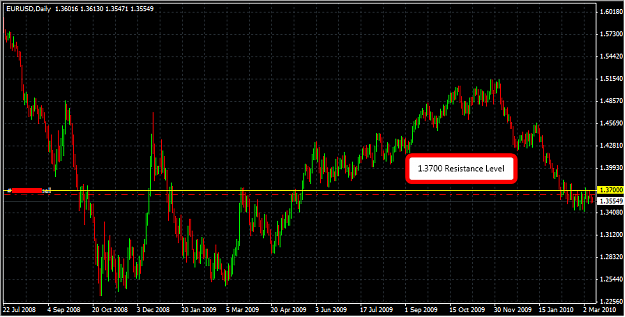
Chart 1 - Resistance shown at 1.3700
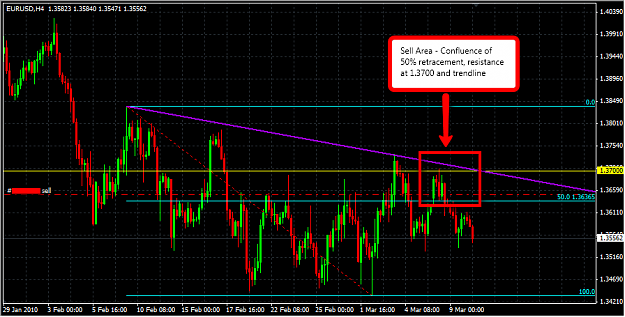
Chart 2 - Confluence of factors; resistance at 1.3700, trendline (as you indicated) and the 50% retracement - creating what I call an "area of interest". It is an area like this that I look for price to slow and start to turn. As it happened, price started to slow in the 1.3680/1.3690 area - it then hit 1.3700 and started to fall, hence my entry at 1.3650.
You are partly right - I did drop down to the H1 to watch for an entry. But my reasons for entering are as follows:
Chart 1 - Resistance shown at 1.3700
Chart 2 - Confluence of factors; resistance at 1.3700, trendline (as you indicated) and the 50% retracement - creating what I call an "area of interest". It is an area like this that I look for price to slow and start to turn. As it happened, price started to slow in the 1.3680/1.3690 area - it then hit 1.3700 and started to fall, hence my entry at 1.3650.
Hope that makes...
Ignored
Hi Dan,
Just been on the dibs thread - interesting team!
I wonder if the s/r will hold up again? I wonder whether 1.37 will be breached in the not to distant future?
Good trading by the way - I'm beginning to understand your set up.
I like your simple, no nonsense style and always trading with the trend. I like trading against sometimes, just for the fun of it - but it's not my long term strategy!