Colored Bubbles.
Not unlike last week, a lot of traders are under the same assumption that we have sold off enough, and it is time to start buying up the chart. As far as things go, this might be what is happening, but lets not lose sight of the other side of the coin.
What if?
Okay, what if we gap down on market?
What if we gap up?
What ranges are we really trading.
There have been a lot of reasonable assumptions for topside target ranges, and I am glad that so far nobody has started posting the 1.6ish target ranges, really, small steps. IF we make it to next support, will it hold and where do we go from there is infinitely a better strategy than buying every spike down hoping to make a zillion pips by owning the bottom of the market.
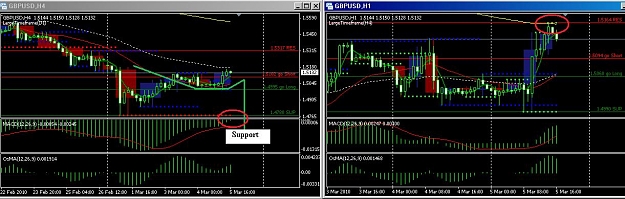
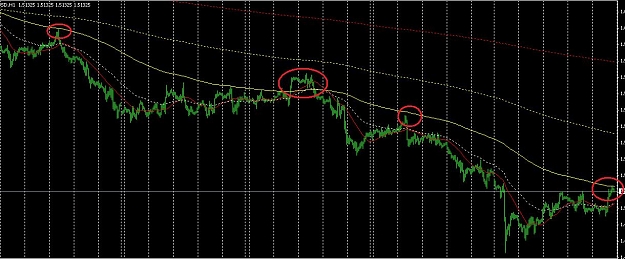
A couple of charts for you to look at, and realize that what we may be seeing here, could be just colored bubbles. Does price have to keep rising?
The 4hr chart shows support on the 24SMA, the trade that we seen on the London to NY sessions crossover. The 200EMA on the 1hr is what proved to be the interm top. K, so now lets just have a looksie at the 1hr 200EMA, and check it's performance over the most immediate span of the market.
Do you see what I see?
We may cross this line, we may still go up, as long as you keep in mind that this could be top and are willing to adjust your trades and positions accordingly, you stand a better chance at this weeks prosperity.
ASSUME nothing. We are still in a long trend bear market and might have already seen the beginning of the end of this bullish leg.
Best of the week to you all!
Not unlike last week, a lot of traders are under the same assumption that we have sold off enough, and it is time to start buying up the chart. As far as things go, this might be what is happening, but lets not lose sight of the other side of the coin.
What if?
Okay, what if we gap down on market?
What if we gap up?
What ranges are we really trading.
There have been a lot of reasonable assumptions for topside target ranges, and I am glad that so far nobody has started posting the 1.6ish target ranges, really, small steps. IF we make it to next support, will it hold and where do we go from there is infinitely a better strategy than buying every spike down hoping to make a zillion pips by owning the bottom of the market.
A couple of charts for you to look at, and realize that what we may be seeing here, could be just colored bubbles. Does price have to keep rising?
The 4hr chart shows support on the 24SMA, the trade that we seen on the London to NY sessions crossover. The 200EMA on the 1hr is what proved to be the interm top. K, so now lets just have a looksie at the 1hr 200EMA, and check it's performance over the most immediate span of the market.
Do you see what I see?
We may cross this line, we may still go up, as long as you keep in mind that this could be top and are willing to adjust your trades and positions accordingly, you stand a better chance at this weeks prosperity.
ASSUME nothing. We are still in a long trend bear market and might have already seen the beginning of the end of this bullish leg.
Best of the week to you all!
Attached Image(s) (click to enlarge)
Money Can't Buy Happiness. Poverty Can't Buy SHIT! You Choose!