This depends on how one trades though.
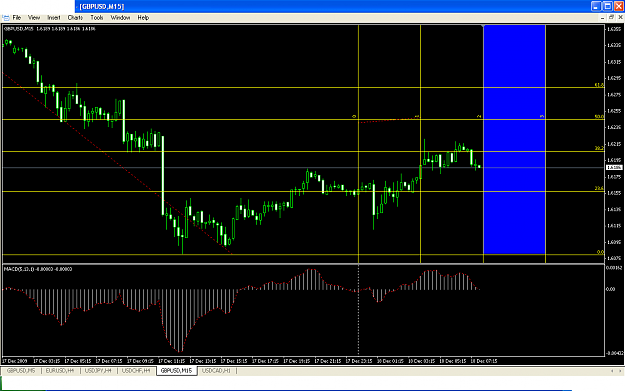
One could draw fibos from the most recent Hi-low
Dec 16 to 17/18 now.
After the break from range.
Interestingly enough bearish M30 started exactly at 38.2.
Perhaps EAs or orders set activated.
I agree with the Higher TF fibo plotting though
One could draw fibos from the most recent Hi-low
Dec 16 to 17/18 now.
After the break from range.
Interestingly enough bearish M30 started exactly at 38.2.
Perhaps EAs or orders set activated.
I agree with the Higher TF fibo plotting though
DislikedPut your fibs on the candles. You will see that everyday usually it retraces up to the 61.8, 50, 38.2 or 0 fib lines. Right now as we speak, it is on the 50 fib line a very excellent spot to continue moving downwards. When it does it may move with pretty good force as well, which may very well be in the London session.Ignored
XAU-XAG/USD_Gold n Silver Trader's Thread = Technicals, Fundamentals & News