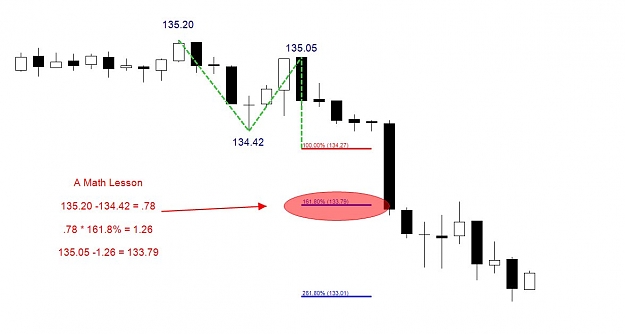
Now, if I had to pick which seemed to be most accurate (so far) on that move, it would be the second illustration......the measure of the first H to L move, with extensions applied thereto without any move.
My point is not how this trade should be "measured" for possible Tps. ddaytrader, you are more experienced, skilled and successful at this than likely anyone else here will be for some time to come. My point is that the references to "162% level, 262% level, etc." don't jive with the real world math. In other words, the 162% level is exactly 162% of ....WHAT????? It is certainly not 162% of the first swing H to L then applied to the second lower high, as the first of the three charts prove.
But, hey......if it works..........(I was just trying to get our numbers to agree, or understand why they weren't.)