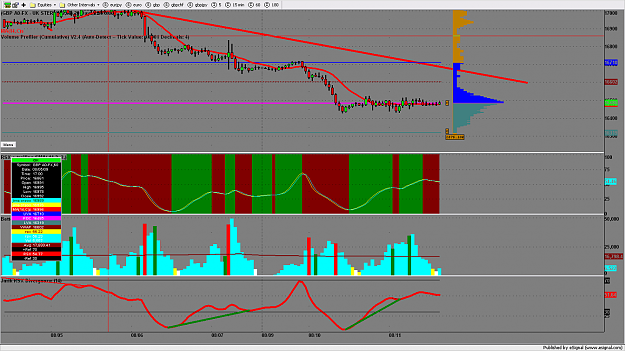
I use volume histogram , so was bored and started looking at the cumulative volume histogram . I came up with this for the 20 day one
the pink line that we are on right now is called the point of control . This is the line that the most activity has occurred in the last 20 days . The point where the max transfers sellers to buyers has occurred.
with price hovering either side of this I would not be trading long or short until the channel 1.6500 to 1.6450 has broken either way
Attached Image (click to enlarge)
Blogging daily now at www.volume.zone