DislikedTo get an idea about next week we have to check out the Weekly chart. Here we see a breech of this Major DTL, however, a 100 pip breech on the weekly is not near enough to say the bears are done. In this picture it looks as if the price is testing the back side of this trendline. There is one thing wrong with this as 2 hits do not a good trendline make. To me, this looks more like a Double top.
A look at the Daily shows price hitting an apex, a cross of a major UTL and a Major DTL. Yellow line shows where Mondays candle will be and if you use...Ignored
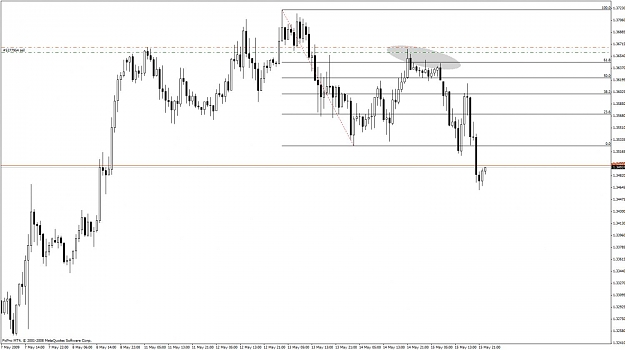
Maybe as an addition to your point of view I would like to add that we have seen three bearish waves on the hourly chart so far. Interesting thing is that the retracements started exactly off the .618 fib of the previous swing. A possible entry to the downside if you already had in mind the developing H&S and wanted to get in early, in hindsight of course, would be after the bearish engulfing bar formed at the very end of the first circled area. Stop loss right above it since it represents a trigger according to my view.
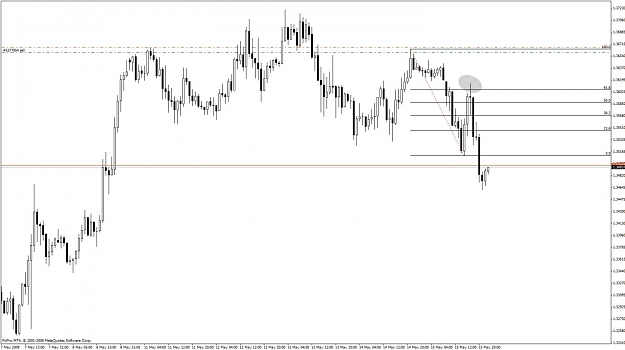
On second chart again the hourly retrace ended as a nice doji. Good place to hide SLs if you already are in some trade. This triggered our final selling wave which in my opinon has ended and is now forming a retracement, or ....how knows a complete reversal, which in my opinion is highly unlikely.
Attached Image(s) (click to enlarge)
Thank you Malcolm, Belekas, Jim, raczekfx and Ryanmcd !