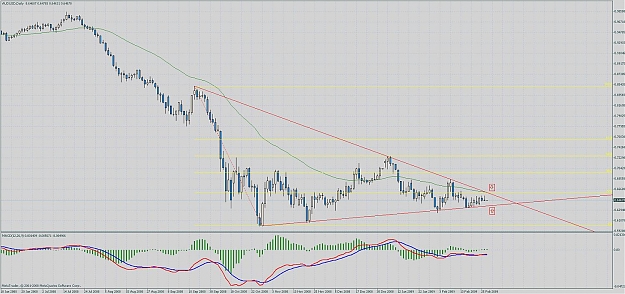
Looking on a daily chart the breakout is comming.
The price consolidates in the triangle.
The upper red arrow show strong resistance, where there are daily 50ema, 23,6 retracement level and a trendline which holds from september. The succesfull break will bring more acceleration of the pair to the upside.
The red arrow in the bottom is a potential support level. When this is broken the pair may test the support level at 0,6 - which is like 6 years low and a big round number
Attached Image (click to enlarge)