Dislikedhi there.
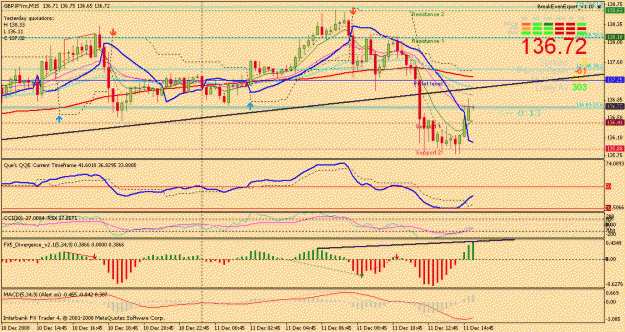
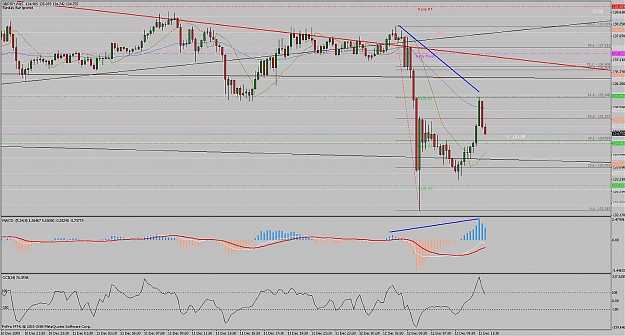
that chart was an ideal world setup for my system. i used it for a clear picture of what i mean. now, if u take a good look at the lines again, u'll see that i market the classic bullish divergence with "green" lines. however, the hidden divergence was marked by a "blue" line.
i'm sure u have a good idea what classic divergence is. hidden div on the other hand is the complete opposite. we had a higher high in price at 241 (weekly chart), and then a LOWER high at 215. MACD had made a HIGHER high when price was at 215. and how did...Ignored
I guess I am getting it now after few month
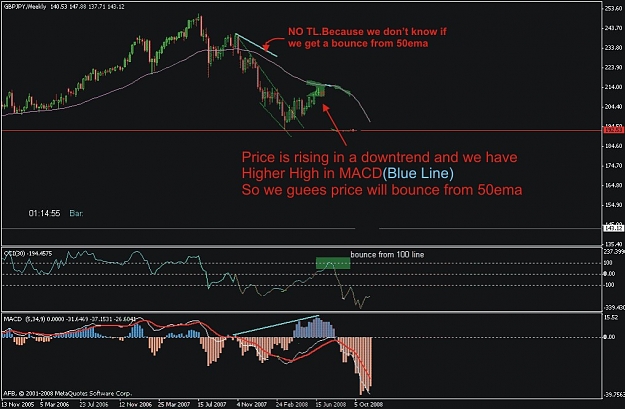
In a downtrend when price start rising and we get a Higher High in MACD we say :"Ok, this is a Bearish HD so it mean trend continuation which is down. SO the best place for price to bounce would be 50 ema.
So we put a sell order on 50 ema.
Is that right?
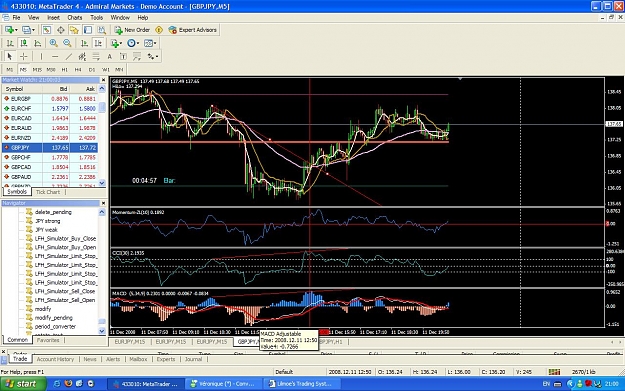
I changed your chart a little bit.If it's wrong let me know to change it please.
Thanks
Mike
Attached Image (click to enlarge)
Failure, is a wonderful teacher!