• Home
  • Forums
  • Trades
  • News
  • Calendar
  • Market
  • Brokers
  • Login
  • Join
  • User/Email: Password:
  • 5:15am
Menu
  • Forums
  • Trades
  • News
  • Calendar
  • Market
  • Brokers
  • Login
  • Join
  • 5:15am
Sister Sites
  • Metals Mine
  • Energy EXCH
  • Crypto Craft

Options

Bookmark Thread

First Page First Unread Last Page Last Post

Print Thread

Similar Threads

Daily Chart 3-Candle 1,351 replies

Daily Candle On Chart Indicator? 6 replies

Weekly chart with daily candle patterns 2 replies

Day's first H4 candle correlation to daily candle 14 replies

Correlation between first 4 hour candle and daily candle 1 reply

  • Interactive Trading
  • /
  • Reply to Thread
  • Subscribe
  • 10,071
Attachments: Daily candle chart
Exit Attachments
Tags: Daily candle chart
Cancel

Daily candle chart

  • Last Post
  •  
  • 1 180181Page 182183184 900
  • 1 Page 182 900
  •  
  • Post #3,621
  • Quote
  • Nov 16, 2008 7:05am Nov 16, 2008 7:05am
  •  hussin naiji
  • Joined Nov 2007 | Status: beginner | 7,710 Posts
Quoting hussin naiji
Disliked
hi dear ayour2a
in the first hearty welcome to you and hope you can use from this thread be useful for you.
ayour2a , read books about japanese candlesticks is very good and important but real problem is real preception from japanese candlesticks for unrarel the mystery of reading candelastick chart.
appearance are deceptive in the world of candlesticks therefore you must beware of the wolf in sheeps cloting.
in the candlestick chart is very the wolf in sheeps cloting that we called defective pattern or false pattern on the other hand trap.
but...
Ignored
hi ayour2a
i have request for opening a library in FF from management of forexfactory
i honorarily will offer more 40 books about forex and stock markets with form PDF till other members can use from this books also other members have books can offer in this library .
im waiting for agreement management of forexfactory
best regards
hussin
 
 
  • Post #3,622
  • Quote
  • Nov 16, 2008 7:44am Nov 16, 2008 7:44am
  •  hussin naiji
  • Joined Nov 2007 | Status: beginner | 7,710 Posts
Quoting hussin naiji
Disliked
also for weekly candel chart GBPUSD
ATTENTION :THIS PATTERN IS WITH LOW RELIABILITY
Ignored
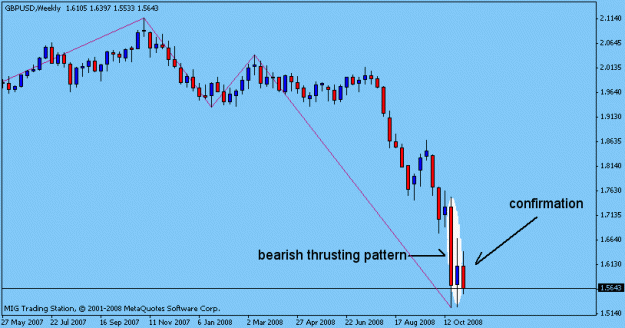
i said in the past week for weekly candle chart GBPUSD we can see a bearish pattern with name bearish thrusting pattern
this pattern is a bearish continuation pattern with low reliability
but after fall the past week now we can see a bearish falling three methods with high reliability.
attention: also this pattern is a bearish continuation pattern
whether with change a bearish pattern from low reliability to hogh reliability we can not see that sellers were aggressive ??
still this pattern shows to us that this reinstates the bear confidence
small lower and upper wicks with long real body the past week is very important for our candlestick analysis
Attached Image(s) (click to enlarge)
Click to Enlarge

Name: 1.gif
Size: 9 KB
Click to Enlarge

Name: 2.gif
Size: 12 KB
 
 
  • Post #3,623
  • Quote
  • Nov 16, 2008 8:05am Nov 16, 2008 8:05am
  •  hussin naiji
  • Joined Nov 2007 | Status: beginner | 7,710 Posts
but one point about WEEKLY CANDLE CHART USDCAD most candlestick analysts especially japanese look at one important factor for inverted signal of a Kabuse patterns :if close real body of blue candle above a Kabuse pattern , this can be a signal for a other strong uptrend
 
 
  • Post #3,624
  • Quote
  • Nov 16, 2008 12:28pm Nov 16, 2008 12:28pm
  •  peaches
  • Joined Oct 2007 | Status: Member | 3,461 Posts
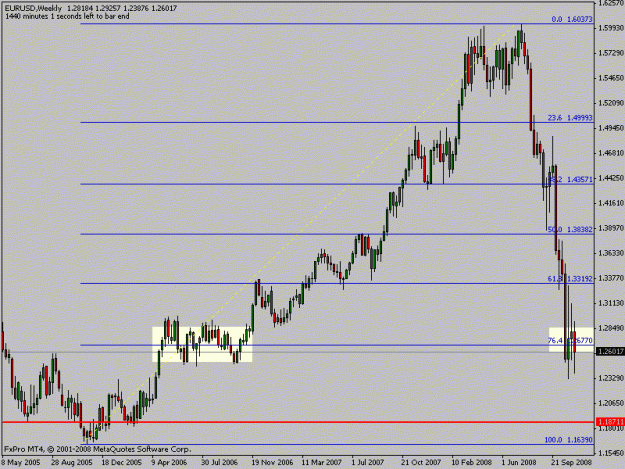
On eur/usd I can not see a pattern. The weekly shows us, that price is - more or less - ranging around 76.4.

We have seen in the past, that this consolidation can stay for a few more weeks.


The daily shows the range 1,30 - 1,25, but the 4 h gives us a downtrending
chanel.

IŽll wait for a bullish breakout of this 4 h channel, or (more possible) a bearish continiuation.

But for now, is see more ranging where we are.
Attached Image(s) (click to enlarge)
Click to Enlarge

Name: eurusdweekly.gif
Size: 14 KB
Click to Enlarge

Name: eurusddaily.gif
Size: 10 KB
Click to Enlarge

Name: eurusd4.gif
Size: 15 KB
 
 
  • Post #3,625
  • Quote
  • Nov 16, 2008 12:40pm Nov 16, 2008 12:40pm
  •  hussin naiji
  • Joined Nov 2007 | Status: beginner | 7,710 Posts
Quoting peaches
Disliked
On eur/usd I can not see a pattern. The weekly shows us, that price is - more or less - ranging around 76.4.

We have seen in the past, that this consolidation can stay for a few more weeks.


The daily shows the range 1,30 - 1,25, but the 4 h gives us a downtrending
chanel.

IŽll wait for a bullish breakout of this 4 h channel, or (more possible) a bearish continiuation.

But for now, is see more ranging where we are.
Ignored
hi peaches
i can see a bearish deliberation pattern for weekly candle chart EURUSD
BUT THIS PATTERN IS A BEARISH REVERSAL PATTERN IN TOP TREND NO BOTTOM TREND
 
 
  • Post #3,626
  • Quote
  • Nov 16, 2008 12:47pm Nov 16, 2008 12:47pm
  •  peaches
  • Joined Oct 2007 | Status: Member | 3,461 Posts
GBPUSD:

On monthly we can see price has reached 161.8 monthly fibo extension level-
Normaly price would consolidate around this price, lets say between 1,45 -1,50, but I agree with hussin, that we see a kind falling three method pattern.

http://www.candlesticker.com/Cs89.asp

The daily gives support for this analyses because we see a broken hammer.
The hammer from thursday was not successfull, because last friday we see a bearish candle.

So, what are the targets, if price does not consolidate and range at 1,45 ?

Well, fibo extension levels are possible targets.
Attached Image(s) (click to enlarge)
Click to Enlarge

Name: gbpusdmonth.gif
Size: 15 KB
Click to Enlarge

Name: gbpusdday2.gif
Size: 10 KB
Click to Enlarge

Name: gbpusdmonth2.gif
Size: 15 KB
 
 
  • Post #3,627
  • Quote
  • Nov 16, 2008 12:48pm Nov 16, 2008 12:48pm
  •  peaches
  • Joined Oct 2007 | Status: Member | 3,461 Posts
Quoting hussin naiji
Disliked
hi peaches
i can see a bearish deliberation pattern for weekly candle chart EURUSD
BUT THIS PATTERN IS A BEARISH REVERSAL PATTERN IN TOP TREND NO BOTTOM TREND
Ignored
It is hard to see pattern for me, if price goes down for month
 
 
  • Post #3,628
  • Quote
  • Nov 16, 2008 12:53pm Nov 16, 2008 12:53pm
  •  hussin naiji
  • Joined Nov 2007 | Status: beginner | 7,710 Posts
Quoting hussin naiji
Disliked
hi peaches
i can see a bearish deliberation pattern for weekly candle chart EURUSD
BUT THIS PATTERN IS A BEARISH REVERSAL PATTERN IN TOP TREND NO BOTTOM TREND
Ignored
FOR WEEKLY CANDLE CHART EURUSD we must look for bullish reversal patterns or bearish continuation patterns therefore the other patterns are worthless.
 
 
  • Post #3,629
  • Quote
  • Nov 16, 2008 1:05pm Nov 16, 2008 1:05pm
  •  peaches
  • Joined Oct 2007 | Status: Member | 3,461 Posts
Quoting sonicdeejay
Disliked
I am glad to find Candlestick stuff here...

Any review for EUR/JPY next week??

Sonic
Ignored
Hi sonic,

best and clear daily candlestick pattern are found on tuesday and wednesday.

The monthly chart shows us, that around 116 has been a support area in the past.

The weekly shows us a neutral highwave candle 2 weeks ago, followed by a bearish weekly candle. The weekly neutral candle was not followed by a bullish candle last week, so I `am expecting more bearish movements.

If we look at the 4 chart, we see a consolidation range between 1,22 - 1,30. So a breakout above the yellow line would give potential for a bullish breakout trade, but I wonŽt take this, because its against the weekly trend.

I wait for a clear daily pattern, or a bearish break below 1,22-1,20 to reach 1,14 again.
Attached Image(s) (click to enlarge)
Click to Enlarge

Name: ejmonth.gif
Size: 18 KB
Click to Enlarge

Name: ejweekly.gif
Size: 15 KB
Click to Enlarge

Name: ej4h.gif
Size: 16 KB
 
 
  • Post #3,630
  • Quote
  • Nov 16, 2008 1:25pm Nov 16, 2008 1:25pm
  •  CandlePower
  • | Joined Apr 2006 | Status: Member | 92 Posts
hi dear hussin & friends,

thnx for all yur valuable charts.

whats yur opinion if we have a daily bullish candlestick but weekly is still in downtrending.

1) is it good to take the daily bullish signal ? or
2) just wait for another daily bearish signal ?

thnx
 
 
  • Post #3,631
  • Quote
  • Nov 16, 2008 2:01pm Nov 16, 2008 2:01pm
  •  ayour2a
  • | Joined Oct 2007 | Status: Member | 415 Posts
Quoting hussin naiji
Disliked
hi ayour2a
i have request for opening a library in FF from management of forexfactory
i honorarily will offer more 40 books about forex and stock markets with form PDF till other members can use from this books also other members have books can offer in this library .
im waiting for agreement management of forexfactory
best regards
hussin
Ignored
Hi Hussin,
thanks for the reply.I would be can if u atleast send me one for the main time to study till u finalise with FF.Thanks.

Ayour2a
 
 
  • Post #3,632
  • Quote
  • Nov 16, 2008 2:50pm Nov 16, 2008 2:50pm
  •  hussin naiji
  • Joined Nov 2007 | Status: beginner | 7,710 Posts
Quoting CandlePower
Disliked
hi dear hussin & friends,

thnx for all yur valuable charts.

whats yur opinion if we have a daily bullish candlestick but weekly is still in downtrending.

1) is it good to take the daily bullish signal ? or
2) just wait for another daily bearish signal ?

thnx
Ignored
hi Candlepower
in the first have hearty welcome for you
and hope this thread be useful for you
you can more explain to me about this daily bullish candlestick pattern:
a bullish reversal candlestick pattern ?
or only a bullish candlestick pattern?
with what reliability ?
with what trading strategy with candlestick pattern(weekly ,daily, intraday) ?
best regards
hussin
 
 
  • Post #3,633
  • Quote
  • Nov 16, 2008 3:04pm Nov 16, 2008 3:04pm
  •  hussin naiji
  • Joined Nov 2007 | Status: beginner | 7,710 Posts
Quoting CandlePower
Disliked
hi dear hussin & friends,

thnx for all yur valuable charts.

whats yur opinion if we have a daily bullish candlestick but weekly is still in downtrending.

1) is it good to take the daily bullish signal ? or
2) just wait for another daily bearish signal ?

thnx
Ignored
if your trading strategy with candlestick pattern is in short-time (daily or intraday) therefore is it good to take the daily bullish signal.
but if your trading strategy with candlestick pattern is in long term (weekly)
therefore just wait for another daily bearish signal or end a correction for bearish signal.
if your daily bullish candlestick pattern is with high reliability ,therefore is it good to take the daily bullish signal
but if is with low reliability ,therefore just wait for another daily bearish signal.
if your daily bullish candlestick pattern is a bullish reversal candlestick pattern ,therefore is it good to take the daily bullish signal.
but i dont think you can see a bullish continuation candlestick pattern in a weekly downtrend.
 
 
  • Post #3,634
  • Quote
  • Nov 16, 2008 3:14pm Nov 16, 2008 3:14pm
  •  hussin naiji
  • Joined Nov 2007 | Status: beginner | 7,710 Posts
Quoting hussin naiji
Disliked
if your trading strategy with candlestick pattern is in short-time (daily or intraday) therefore is it good to take the daily bullish signal.
but if your trading strategy with candlestick pattern is in long term (weekly)
therefore just wait for another daily bearish signal or end a correction for bearish signal.
if your daily bullish candlestick pattern is with high reliability ,therefore is it good to take the daily bullish signal
but if is with low reliability ,therefore just wait for another daily bearish signal.
if your daily bullish candlestick...
Ignored
in general ,markets move sideways about 68-75 percent of the time and big moves in the remaining 25-32 percent.
therefore in the weekly candle charts we only can see since 1 year 13-18 reversal candlestick pattern (bullish or bearish) but can see more and more continuation candlestick patterns (bullish or bearish)
 
 
  • Post #3,635
  • Quote
  • Nov 16, 2008 3:35pm Nov 16, 2008 3:35pm
  •  hussin naiji
  • Joined Nov 2007 | Status: beginner | 7,710 Posts
in the weekly candle chart CADYEN after a pullback now we can see a bearish advance block pattern.
whether need for a confirmation ?
Attached Image (click to enlarge)
Click to Enlarge

Name: 2.gif
Size: 11 KB
 
 
  • Post #3,636
  • Quote
  • Nov 16, 2008 4:21pm Nov 16, 2008 4:21pm
  •  peaches
  • Joined Oct 2007 | Status: Member | 3,461 Posts
On 4 h geppy we have seen a doji from last friday, and
sunday opening given a large downward window/gap.

Those gaps often work as areas of support and resistance,
and they give often the direction of the price move in future.

At the top or bottom of a trend they form high reliable pattern,
for example evening star or morning star pattern:

http://www.candlesticker.com/Cs73.asp

http://www.candlesticker.com/Cs60.asp

But on 4 h chart is less reliable, and at the moment it is not a
valid pattern.
Attached Image (click to enlarge)
Click to Enlarge

Name: geppy4h.gif
Size: 15 KB
 
 
  • Post #3,637
  • Quote
  • Nov 16, 2008 4:30pm Nov 16, 2008 4:30pm
  •  peaches
  • Joined Oct 2007 | Status: Member | 3,461 Posts
Quoting CandlePower
Disliked
hi dear hussin & friends,

thnx for all yur valuable charts.

whats yur opinion if we have a daily bullish candlestick but weekly is still in downtrending.

1) is it good to take the daily bullish signal ? or
2) just wait for another daily bearish signal ?

thnx
Ignored
It is difficult to decide, and depends of you like to have high risk.

For example last bullish engulfing candle for geppy. If you decide at daily close of the bullish candle, you see price went down 38.2 retracement against you, before going higher. It popped up a bit more in the following days, but strong weekly trend limited bullish movement. For conservative trader its better not to go against the weekly trend, better miss 2 or 3 days trading, and go short, if you see a top.
Attached Image (click to enlarge)
Click to Enlarge

Name: geppy.gif
Size: 13 KB
 
 
  • Post #3,638
  • Quote
  • Nov 16, 2008 6:49pm Nov 16, 2008 6:49pm
  •  CandlePower
  • | Joined Apr 2006 | Status: Member | 92 Posts
thnx alot brother hussin & peaches for yur kind reply, very much appriciated. Keep up the good work.
 
 
  • Post #3,639
  • Quote
  • Nov 17, 2008 2:11am Nov 17, 2008 2:11am
  •  peaches
  • Joined Oct 2007 | Status: Member | 3,461 Posts
Hussin,

what do you think about daily TNX ? Friday was a doji, thursday was a large bullish candle. Might be, that todays US session is the key for development in the next days.


  • Post #3,640
  • Quote
  • Nov 17, 2008 4:59pm Nov 17, 2008 4:59pm
  •  peaches
  • Joined Oct 2007 | Status: Member | 3,461 Posts
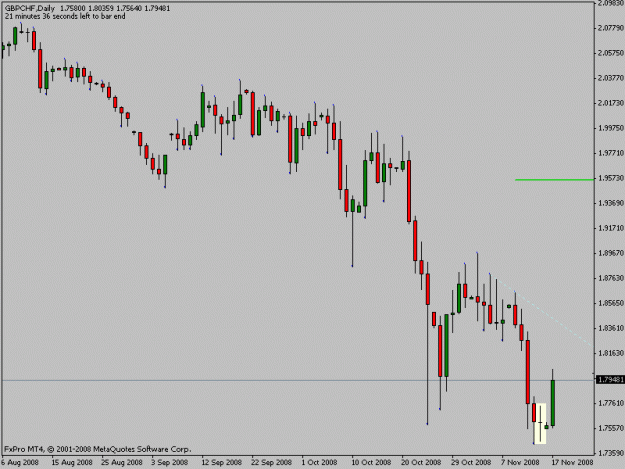
Today most exciting pair I think, is GBP/CHF. We may observe candlestick pattern play together or maybe against fibo levels from this.

After we have seen on friday a long legged doji indicision candle, to day was a large bullish (engulfing) pattern. We should keep in mind, daily is a strong candle, more stronger then lower timeframes.

If we look close we see, that todays candle stopped exactly at the 50% fibo level from the last bear drop.

On the 4 h chart we see a doji or kind of shooting star indicatiing selling pressure.

So we may expect on daily timeframe a bullish move, but on lower timeframe a bearish one. + the daily was a 50 % retracement of the last big bear fall.

So IŽll watch out for a 38.2 (1.78) or 50 % (1.773) fibo retracement of todays bull move. Around this levels the big question is, if A) the power of the daily bullish candle will play out or B) if the 50 % fibolevel of the last bear move (the top of todays bullish candle) will limit the power of todays bullish candle

If we see a bullish continuation at 1.78 or 1.773 there might be a "cup and handle" formation on this one (which belongs to another thread, it is not a candlestick pattern).
Attached Image(s) (click to enlarge)
Click to Enlarge

Name: gbpchf.gif
Size: 11 KB
Click to Enlarge

Name: gbpchffib.gif
Size: 12 KB
Click to Enlarge

Name: gbpchf4h.gif
Size: 14 KB
 
 
  • Interactive Trading
  • /
  • Daily candle chart
  • Reply to Thread
    • 1 180181Page 182183184 900
    • 1 Page 182 900
0 traders viewing now
  • More
Top of Page
  • Facebook
  • Twitter
About FF
  • Mission
  • Products
  • User Guide
  • Media Kit
  • Blog
  • Contact
FF Products
  • Forums
  • Trades
  • Calendar
  • News
  • Market
  • Brokers
  • Trade Explorer
FF Website
  • Homepage
  • Search
  • Members
  • Report a Bug
Follow FF
  • Facebook
  • Twitter

FF Sister Sites:

  • Metals Mine
  • Energy EXCH
  • Crypto Craft

Forex Factory® is a brand of Fair Economy, Inc.

Terms of Service / ©2023