NO Trolling & No Other Indicators Please & Thanks!
Spend time to go through the thread and you will understand the system.
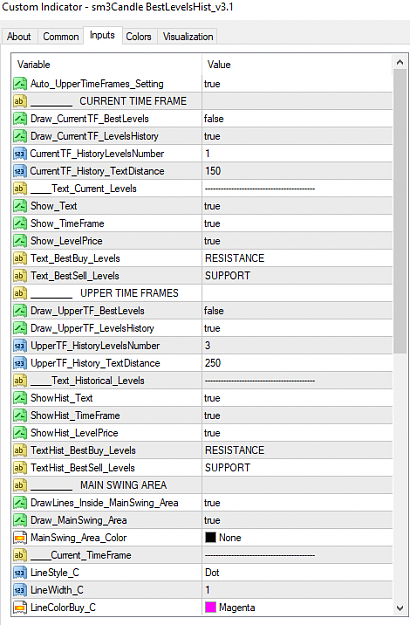
We are trading SWING POINTS (123 ideal Reversal Candle System) and SUPPORT & RESISTANCE(Best Buy/Best Sell Levels). Please see attached indicators with Suggested Settings.
THE SWING POINT
This system is used for trading Reversals. The indicator shows the trigger line at which we take our entries. Sometimes price may go to the high of the Bearish Swing Point, if Sellers want to sell higher and Buyers will go down to the low of the Bullish Swing Point, if Buyers want to buy lower. Therefore, your stop loss must be placed above/below the Swing Point. Please note some improvements have been made on the system to filter fakeouts as much as possible. Please download the indicator attached. Study the ideal setup described in this post to get an understanding of how the system works.
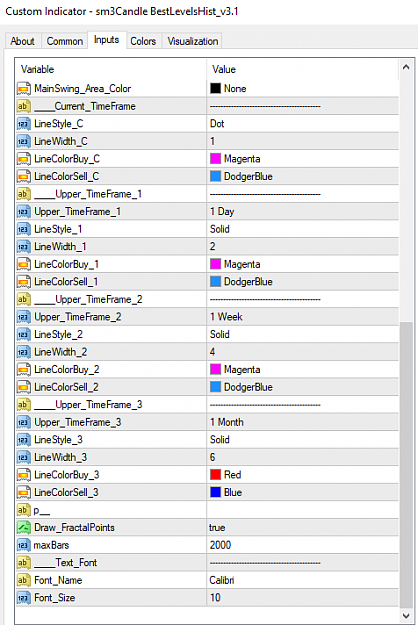
BEST BUY & SELL LEVELS
This system is mainly used for trend continuation on entries, once price stalls above a Best Buy or Sell Line we BUY, AND below a Best Buy or Sell Line, we SELL. Please download the indicator below. This post will be further updated with the recommended settings. To get an overview of this aspect of the Strategy, please read posts #441 onwards. These lines simply represent Support & Resistance Levels. Our approach is to BUY SUPPORT & SELL RESISTANCE. When Support turns Resistance we sell. When Resistance turns support, we buy.
FACTS 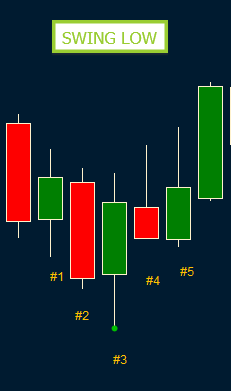

PAIRS TRADED 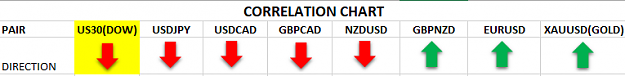
THE LONG(BUY) TRADE
ideal BUY SCENARIO#1 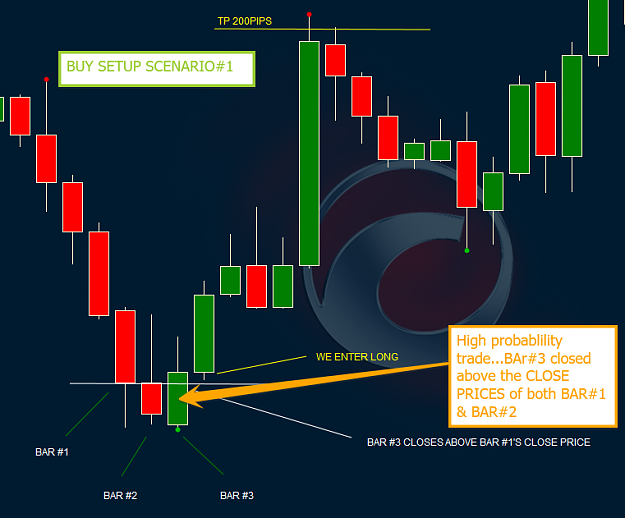
OTHER BUY SCENARIOS
These will occur when BAR#4 OR BAR #5 close ABOVE 'the' BAR#1 & BAR#2 Prices. The same rules apply for taking the trade as outlined in BUY Scenario#1
THE SHORT(SELL) TRADE
ideal SELL SCENARIO#1 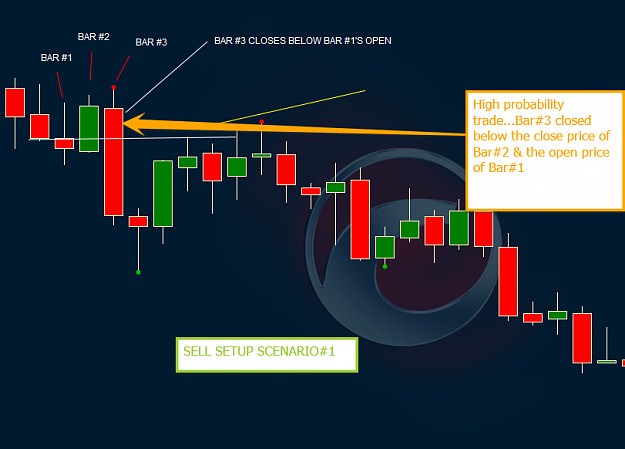
OTHER SELL SCENARIOS
These will occur when BAR#4 OR BAR #5 close BELOW 'the' BAR#1 & BAR#2 Prices. The same rules apply for taking the trade as outlined in SELL Scenario#1
BUYING & SELLING REJECTION LEVELS
These are important to look at because the first sign BUYERS are exhausted is that there is resistance against every opportunity to continue to higher prices and the first sign that SELLERS are exhausted is that there is resistance against every opportunity to drive prices lower.
Where do we find these levels?
Buying Rejection levels are found at the HIGHEST BULLISH CLOSE PRICE of a Swing Low.
Selling Rejection levels are found at the LOWEST BEARISH CLOSE PRICE of a Swing high.
NOTES & TIPS
Spend time to go through the thread and you will understand the system.
We are trading SWING POINTS (123 ideal Reversal Candle System) and SUPPORT & RESISTANCE(Best Buy/Best Sell Levels). Please see attached indicators with Suggested Settings.
THE SWING POINT
This system is used for trading Reversals. The indicator shows the trigger line at which we take our entries. Sometimes price may go to the high of the Bearish Swing Point, if Sellers want to sell higher and Buyers will go down to the low of the Bullish Swing Point, if Buyers want to buy lower. Therefore, your stop loss must be placed above/below the Swing Point. Please note some improvements have been made on the system to filter fakeouts as much as possible. Please download the indicator attached. Study the ideal setup described in this post to get an understanding of how the system works.
BEST BUY & SELL LEVELS
This system is mainly used for trend continuation on entries, once price stalls above a Best Buy or Sell Line we BUY, AND below a Best Buy or Sell Line, we SELL. Please download the indicator below. This post will be further updated with the recommended settings. To get an overview of this aspect of the Strategy, please read posts #441 onwards. These lines simply represent Support & Resistance Levels. Our approach is to BUY SUPPORT & SELL RESISTANCE. When Support turns Resistance we sell. When Resistance turns support, we buy.
FACTS
- The market TRENDS more than it BENDS/REVERSES.
- Knowing targeted reversal points Helps for Reversal or Continuation Decisions.
- If I miss a strong reversal I can always get in on a LOWER TIME FRAME REVERSAL or A REVERSAL REJECTION SETUP.
- We will take trades Mainly on H4, H12 & Daily Charts or according to the Daily Chart trend on lower timeframes such as H1. If you trade on H1 take smaller profit.
- The market reverses a trend through a 'U-Turn' formation called a SWING HIGH or SWING LOW.
- This system pre-emptively identifies the 'TARGET' reversal point to help us trade a REVERSE or CONTINUATION.
- Five bars make up a Swing High or Swing Low.
- At ALL times BAR#3 is the "peak" bar.
- Scenarios #1 described below, are our ideal trade.
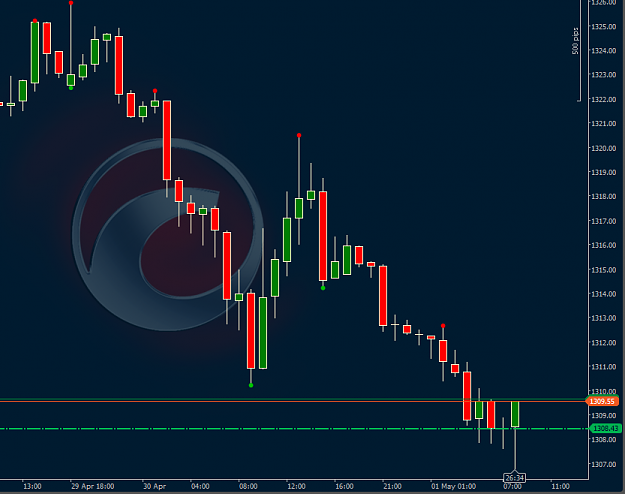
Attached Image
Attached Image
PAIRS TRADED
- EURUSD, NZDUSD, USDCAD, XAUUSD, USDJPY
- Newly Added GBPCAD, GBPNZD - great help with USDCAD & NZDUSD trades
- Crypto Pair LTCUSD - also great for helping with determining USD strength
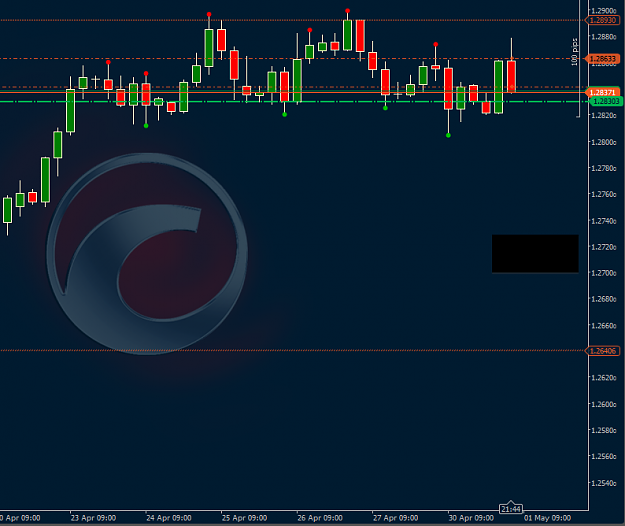
Attached Image (click to enlarge)
NB: I also watch the US30 and the USDX to get confirmation on USDJPY direction, and general sentiment on the dollar. A good resource for more information.
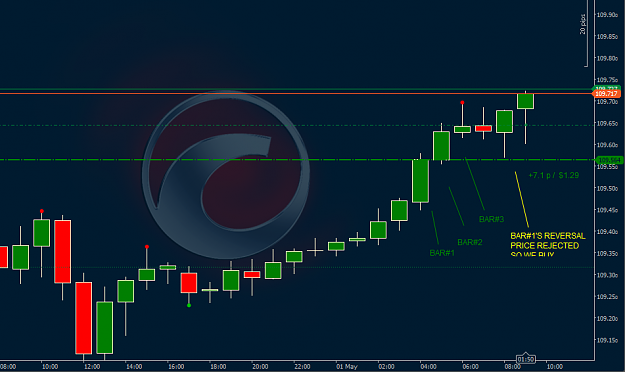
THE LONG(BUY) TRADE
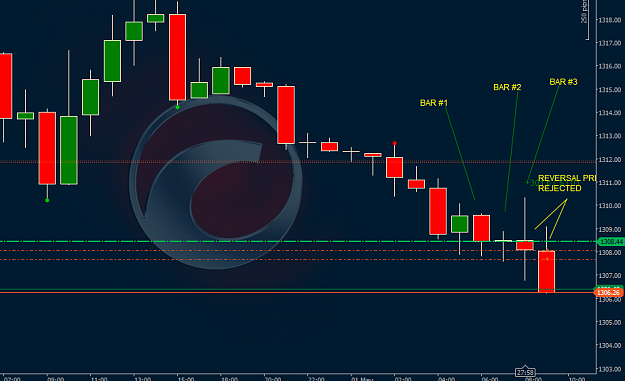
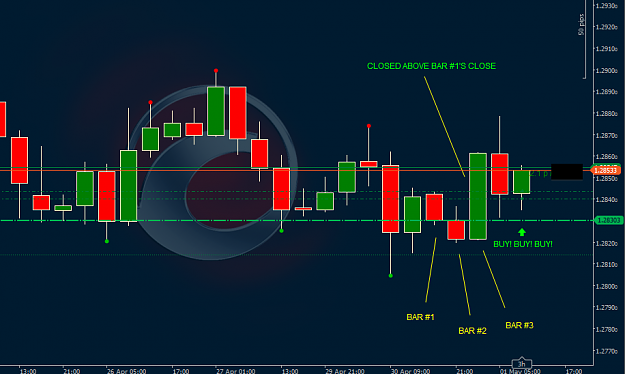
ideal BUY SCENARIO#1
- Market is tending downwards (at least for 3 days). Downtrend - Creating lower highs and lower lows.
- The LAST BAR (BAR#3) closes with two bars having higher lows on its LEFT
- BAR#3 closes ABOVE the CLOSE PRICE OF BAR#1 (if BAR#1 has a BEARISH BODY) OR above the OPEN PRICE OF BAR#1 (if BAR#1 has a BULLISH BODY).
- Open a BUY TRADE OR BUY LIMIT at BAR#1's OPEN (if BAR#1 has a bullish body) or at the CLOSE (if BAR#1 has a BEARISH BODY)
- Stop should be placed at 50 pips or 15 pips below BAR#2's Low, whichever is greater. If BAR#1 has a lower low than BAR#2, we use BAR#1's Low - 15pips for our stop.
- The average Take Profit is 100-200 PIPS. Swingers may hold longer.
- Assess the Win Probability.
- The WIN probability is higher when BAR#3 closes ABOVE Both "the" BAR#1 & BAR#2 prices.
- The WIN probability is higher when BAR#3 closes ABOVE Both "the" BAR#1 & BAR#2 prices AND the BAR#1 and BAR#2 prices are close to or at the same level.
- The above is important because rejection of reversals are common at the BAR#1 PRICE
Attached Image (click to enlarge)
OTHER BUY SCENARIOS
These will occur when BAR#4 OR BAR #5 close ABOVE 'the' BAR#1 & BAR#2 Prices. The same rules apply for taking the trade as outlined in BUY Scenario#1
THE SHORT(SELL) TRADE
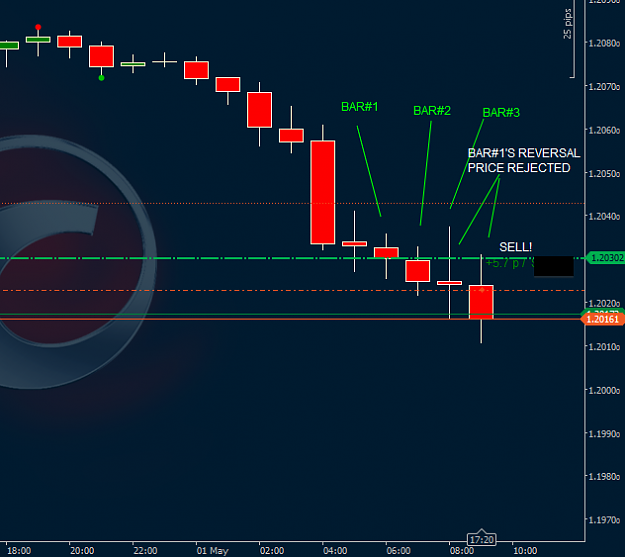
ideal SELL SCENARIO#1
- Market is tending upwards (at least for 3 days).Uptrend - Creating Higher highs and higher lows.
- The LAST BAR (BAR#3) closes with two bars having lower high on its LEFT
- BAR#3 closes below the CLOSE PRICE OF BAR#1 (if BAR#1 has a BULLISH BODY) OR below the OPEN PRICE OF BAR#1 (if BAR#1 has a BEARISH BODY).
- Open a SELL TRADE OR SELL LIMIT at BAR#1's OPEN (if BAR#1 has a BEARISH BODY) or at the CLOSE (if BAR#1 has a BULLISH BODY)
- Stop should be placed at 50 pips or 15 pips above BAR#2's high, whichever is greater. If BAR#1 has a higher high than BAR#2, we use BAR#1's High + 15pips for our stop.
- The average Take Profit is 100-200 PIPS. Swingers may hold longer.
- Assess the Win Probability.
- The WIN probability is higher when BAR#3 closes BELOW Both "the" BAR#1 & BAR#2 prices.
- The WIN probability is higher when BAR#3 closes BELOW Both "the" BAR#1 & BAR#2 prices AND the BAR#1 and BAR#2 prices are close to or at the same level.
- The above is important because rejection of reversals are common at the BAR#1 PRICE
Attached Image (click to enlarge)
OTHER SELL SCENARIOS
These will occur when BAR#4 OR BAR #5 close BELOW 'the' BAR#1 & BAR#2 Prices. The same rules apply for taking the trade as outlined in SELL Scenario#1
BUYING & SELLING REJECTION LEVELS
These are important to look at because the first sign BUYERS are exhausted is that there is resistance against every opportunity to continue to higher prices and the first sign that SELLERS are exhausted is that there is resistance against every opportunity to drive prices lower.
Where do we find these levels?
Buying Rejection levels are found at the HIGHEST BULLISH CLOSE PRICE of a Swing Low.
Selling Rejection levels are found at the LOWEST BEARISH CLOSE PRICE of a Swing high.
NOTES & TIPS
- Keep Take Profit at 100 pips for counter trend setups.
- If price is failing at bar #1's price, the trend will continue.
- If you are in a short/sell trade and price keeps failing (not able to close below) at the close price of the Lowest Bearish Close Price of the Swing High Structure, the market could be looking to go bullish, protect your trade or take profits. Otherwise, stronger selling ahead.
- If you are in a long/buy trade and price keeps failing (not able to close above) at the close price of the Highest Bullish Close Price of the Swing Low Structure, the market could be looking to go bearish, protect your trade or take profits. Otherwise, stronger buying ahead.
Attached Image(s) (click to enlarge)
Attached File(s)
Hero Traders Live to see their Accounts Die!