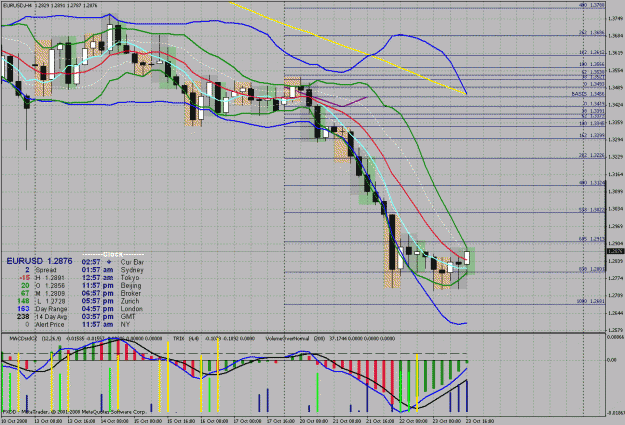
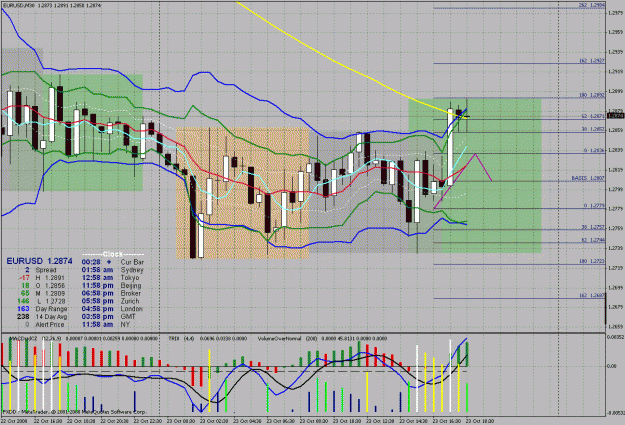
The attached 4hr. chart shows pinching in-process on inner Bollinger band, which will require some more timeframes to complete and show a breakout. Note the run down resulted in nice candle base at the 838% extension level. The 30 chart shows a nice dual Bollinger band pinch, with breakout in process. But I should not be surprised if they knock it back down to the 1.2838 area before ramming it upwards....maybe even lower, as the volume seems to be saying that they are loading up long positions now. If so, they will REALLY load up, which will require time.
Attached Image(s) (click to enlarge)