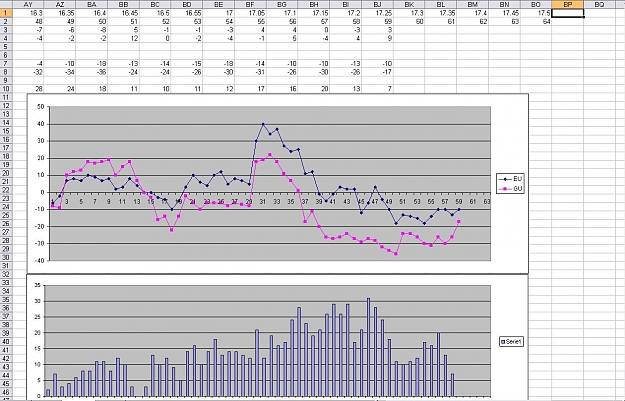
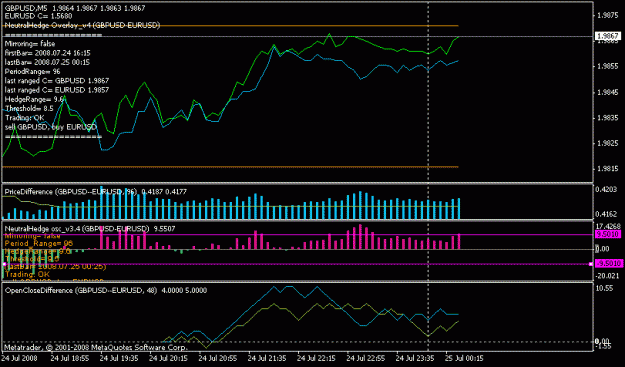
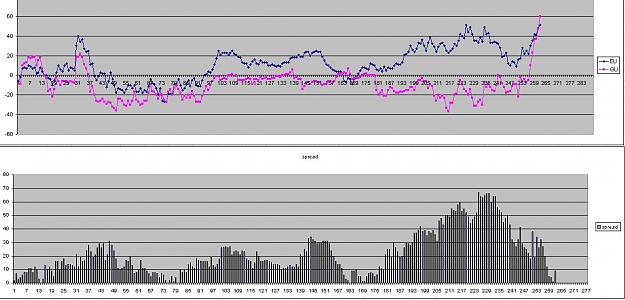
FXFORCE has posted a couple of indicators that determine the relative strength of the individual currencies. It might be a good idea to start this indicator when the currencies in question show parity. We can determine that by looking back at his indicator.