• Home
  • Forums
  • Trades
  • News
  • Calendar
  • Market
  • Brokers
  • Login
  • Join
  • User/Email: Password:
  • 8:06am
Menu
  • Forums
  • Trades
  • News
  • Calendar
  • Market
  • Brokers
  • Login
  • Join
  • 8:06am
Sister Sites
  • Metals Mine
  • Energy EXCH
  • Crypto Craft

Options

Bookmark Thread

First Page First Unread Last Page Last Post

Print Thread

Similar Threads

Spectre's Corner 273 replies

Zeusjoes Market-Neutral Hedge Strategy 797 replies

FX Market Neutral Systems 5 replies

Statistical mean of the market [quant corner] 191 replies

Complete Trader's Corner, by Sam Shenker 0 replies

  • Trading Discussion
  • /
  • Reply to Thread
  • Subscribe
  • 6
Attachments: Market Neutral Corner
Exit Attachments
Tags: Market Neutral Corner
Cancel

Market Neutral Corner

  • Last Post
  •  
  • Page 1 2
  • Page 1 2
  •  
  • Post #1
  • Quote
  • First Post: Jan 26, 2016 8:19am Jan 26, 2016 8:19am
  •  Tardigrade
  • | Joined Oct 2015 | Status: A Skeptic | 144 Posts
"Ice-cream Speculation"

Two ice-cream vendors approaches your house
One sell chocolate for $5 the other caramel for $2
The trader inside you scream like a maniac: how could you charge so much for a chocolate cone while your competitor priced much lower?!

"Outright"

Scenario A
“Let me tell you how to run a fair price business ---I bet your price will go down, I'm shorting 10 contract of you vicious chocolate man!”

Scenario B
“Let me tell you how to run a profitable operation ---I bet your price will go up, I'm longing 25 contract of you my venerable caramel buddy!”


"Spreading"

“Let me tell you how to run a fair price business ---I bet your unjustifiable price will go down, I'm shorting 10 contract of you, vicious chocolate man! In the mean time I'm longing 10 contract of your competitor!"

"Market Neutral"

"I'm shorting 10 contract of you while longing 25 contract of your caramel competitor!"

"Outright Goes South"

Scenario A
"Wait wait wait, your chocolate cone's price keep rising and there are more suckas willing to pay for that???"

Scenario B
"What are you doing, grow a pair and attract more demand caramel!!!"

"Market Neutral Goes South"

Scenario A
"Dang, chocolate cone price did go down, yet I didn't short enough of it to offset the lost I took on caramel go down at the same time!!!"
Scenario B
"Dang, caramel cone price did go up, yet I didn't long enough of it to offset the lost I took on chocolate go up at the same time!!!"
Scenario C
"Chocolate keep skyrocketing, caramel keep plunging down...Oh well, I guess I shouldn't've told them how to run their own business, huh?"


For Market-Neutral Concepts & Strategy Discussion Only, thanks.
No Highs? No Lows? Must be Bose!
  • Post #2
  • Quote
  • Jan 26, 2016 8:24am Jan 26, 2016 8:24am
  •  Tardigrade
  • | Joined Oct 2015 | Status: A Skeptic | 144 Posts

Summary of Existing Method to Reach "Neutrality"


*Post Later*

Fundamental


Technical


Statistical
No Highs? No Lows? Must be Bose!
 
 
  • Post #3
  • Quote
  • Jan 26, 2016 7:30pm Jan 26, 2016 7:30pm
  •  davelansing
  • Joined Feb 2009 | Status: Member | 458 Posts
This should be an interesting discussion...

Dave
 
 
  • Post #4
  • Quote
  • Jan 27, 2016 9:35am Jan 27, 2016 9:35am
  •  Tardigrade
  • | Joined Oct 2015 | Status: A Skeptic | 144 Posts

Summary of Existing Method to Reach "Neutrality"


Fundamental

Asset Classes with High Geopolitical Correlation-European Union, Oil Exporting Countries, Oceania Countries, South America Countries, etc.
Asset Classes with High Intramarket Correlation-Calendar Spread, Spot/Futures Spread, Spot/Options Pricing, HFT on time lag, etc.
Asset Classes with High Intermarket Correlation-Dollar Quoted Assets, Public Companies within the Same Sector/Industry/Target Audience,etc.
Asset Classes with High Triangular Correlation- EURUSD-EURGBP-GBPUSD circle, USDCAD-CADJPY-USDJPY circle, etc.
Equity Long Short Portfolio
Merger Arbitrage

Technical

N/A

Statistical
Measurement of Distance: Normalized Deviation, Co-integration, Linear Regression, Beta Coefficient, etc.
Measurement of Direction/Strength: Correlation Coefficient(Pearson, Spearman, Kendall)
No Highs? No Lows? Must be Bose!
 
 
  • Post #5
  • Quote
  • Jan 27, 2016 9:41am Jan 27, 2016 9:41am
  •  Tardigrade
  • | Joined Oct 2015 | Status: A Skeptic | 144 Posts
Since I am not a big fan of standard deviation/normal distribution, plus more free parameters=more overfitting, my own focus is on Correlation Coefficient only with supplementary method to calculate distance

Share your thought and we may have some discussions going.
No Highs? No Lows? Must be Bose!
 
 
  • Post #6
  • Quote
  • Jan 27, 2016 10:54am Jan 27, 2016 10:54am
  •  PipMeUp
  • Joined Aug 2011 | Status: Member | 1,305 Posts
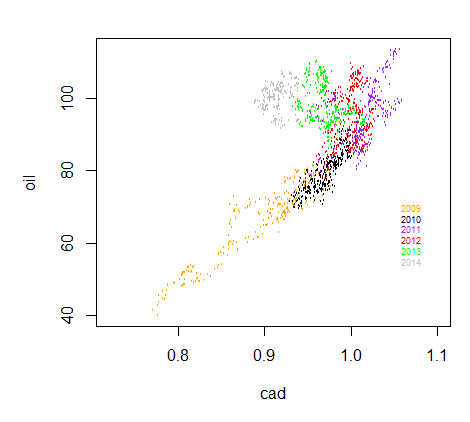
Care is to be taken when using correlation coefficient. You may well find fake relationships due to a "third party" correlator, usually USD. For instance you would easily find a high correlation between USD/CAD and WTI oil. Yet this correlation is mainly coming from the strength/weakness of USD. These two assets used to be cointegrated but they no longer are despite what a lot of people keep believing. This is an image I made long ago (there is no data for 2015) that clearly shows it. It shows the returns of Oil vs the returns of CAD/USD (reversed to have the same quote currency)

Attached Image


Also I don't see the circular baskets like EURUSD-EURGBP-GBPUSD to be fundamentally correlated. They are mechanically linked through the no-arb EURGBP = EURUSD / GBPUSD at any time.
No greed. No fear. Just maths.
 
 
  • Post #7
  • Quote
  • Jan 27, 2016 10:57am Jan 27, 2016 10:57am
  •  PipMeUp
  • Joined Aug 2011 | Status: Member | 1,305 Posts
This being said I'm very interested in your way to manage the positions without using standard deviation or at least quantiles of some distribution. I'm all ears.
No greed. No fear. Just maths.
 
 
  • Post #8
  • Quote
  • Edited Jan 28, 2016 10:29am Jan 27, 2016 11:49am | Edited Jan 28, 2016 10:29am
  •  Tardigrade
  • | Joined Oct 2015 | Status: A Skeptic | 144 Posts
Quoting PipMeUp
Disliked
Care is to be taken when using correlation coefficient. You may well find fake relationships due to a "third party" correlator, usually USD. For instance you would easily find a high correlation between USD/CAD and WTI oil. Yet this correlation is mainly coming from the strength/weakness of USD. These two assets used to be cointegrated but they no longer are despite what a lot of people keep believing. This is an image I made long ago (there is no data for 2015) that clearly shows it. It shows the returns of Oil vs the returns of CAD/USD (reversed...
Ignored
Yes, I agree. One should take extra care to work around spurious correlation with a common divisor; on the flip side, however, if you've mined a correlated/co-integrated pair with no common denominator, would you have traded them without additional screening? (Somehow this phenomena appeared more often in co-integration). Hmm I'll think about it, and thanks for the heads-up.

In terms of hedge ratio, now I am exploring two approaches, either model-free brute force or nonparametric regression. I strive to use as many nonparametrics as possible.

Here's a great article about Kernel Regression.
Attached File(s)
File Type: pdf Nonparametric Kernel Estimation of Multiple Hedge Ratios.pdf   126 KB | 295 downloads
No Highs? No Lows? Must be Bose!
 
 
  • Post #9
  • Quote
  • Jan 27, 2016 4:36pm Jan 27, 2016 4:36pm
  •  GoldTheHun
  • Joined Nov 2014 | Status: Member | 394 Posts
Quoting Tardigrade
Disliked
{quote} Yes, I agree. One should take extra care to work around spurious correlation with a common divisor; on the flip side, however, if you've mined a correlated/co-integrated pair with no common denominator, would you have traded them without additional screening? (Somehow this phenomena appeared more often in co-integration). Hmm I'll think about it, and thanks for the heads-up. In terms of hedge ratio, now I am exploring two approaches, either model-free brute force or nonparametric regression. I strive to use as many nonparametrics as possible....
Ignored
Excellent thread... Tardigrade, thank you for starting it.

As for the hedge ratio I use a very simple method, which worked fairly good for me.

PairA Ratio = (AverageDailyRange of Pair B * pipvalue of Pair B) / ((AverageDailyRange of Pair B * pipvalue of Pair B) + (AverageDailyRange of Pair A * pipvalue of Pair A))

PairB Ratio = (AverageDailyRange of Pair A * pipvalue of Pair A) / ((AverageDailyRange of Pair B * pipvalue of Pair B) + (AverageDailyRange of Pair A * pipvalue of Pair A))

Thanks once again...
RandomWalk All Time Return: 10.3%
 
 
  • Post #10
  • Quote
  • Jan 27, 2016 8:57pm Jan 27, 2016 8:57pm
  •  Tardigrade
  • | Joined Oct 2015 | Status: A Skeptic | 144 Posts
Thank you for contributing!

​​I came across the idea you post earlier, but didn't pursue any further coz' selecting a proper look-back window is more discretionary than it appears.

​​If I'm not mistaken, conceptually speaking the algo you mentioned is a derivative of Beta but trimmed to fit pairs trading? I remember reading it somewhere, perhaps "Trading Spreads and Seasonals"?

​​It's good to know you've managed to captured some decent profit utilizing a simple algo with only one parameter, thanks
No Highs? No Lows? Must be Bose!
 
 
  • Post #11
  • Quote
  • Jan 28, 2016 5:25am Jan 28, 2016 5:25am
  •  Tardigrade
  • | Joined Oct 2015 | Status: A Skeptic | 144 Posts
"Market Neutral" is a confusing & oversimplified term; neutral to what exactly? Neutral to certain currency exposure? Neutral to equity market risk overall? Neutral to Delta? Neutral to what kind of basis risk?

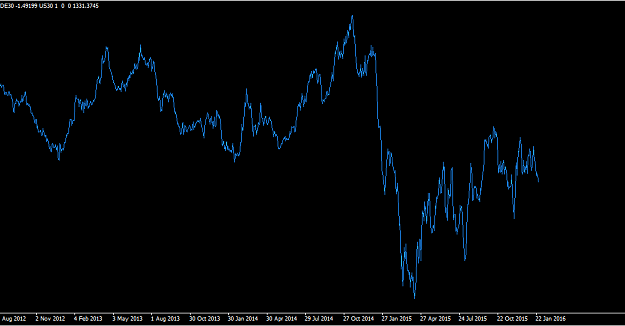
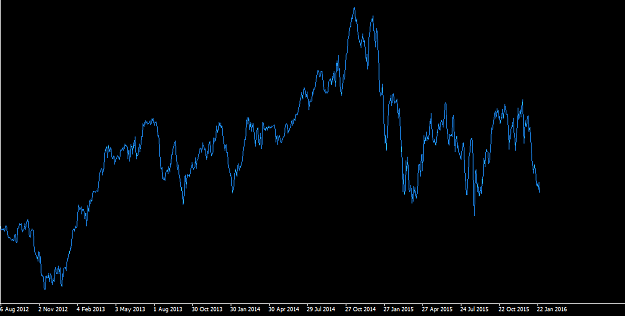
After we apply some makeup *cough* I mean stationary process on financial time series, sure it is de-trended enough to look "neutral" to the naked-eye.

Ex.
DOW & DAX, Dollar Neutral "Without Makeup"
Attached Image (click to enlarge)
Click to Enlarge

Name: No Makeup.png
Size: 10 KB


DOW & DAX, "With Eyeliner, Foundation Shade, Lipsticks, etc"
Attached Image (click to enlarge)
Click to Enlarge

Name: After Makeup.png
Size: 10 KB


"Neutral to what exactly" is the mega-billion question to which I don't have an answer at the moment.
No Highs? No Lows? Must be Bose!
 
 
  • Post #12
  • Quote
  • Jan 29, 2016 8:20am Jan 29, 2016 8:20am
  •  merquise
  • | Joined Jun 2014 | Status: Member | 371 Posts
Neutral to direction..

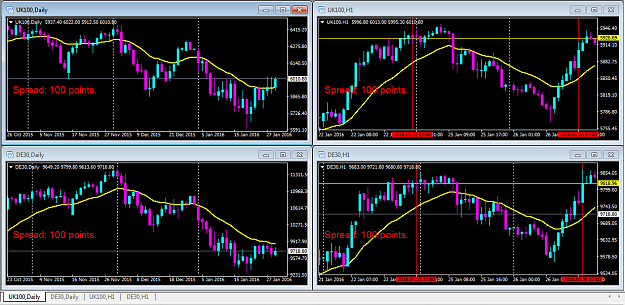
Looking at DAX-FTSE - correlation of 93.5% (http://www.myfxbook.com/forex-market/correlation) , had you sold FTSE and bought DAX at levels marked, also if you got out at levels indicated you could have been in profit.. So called spread trading, nothing new, you just need to have time frame in mind and profit and loss numbers (like closing with 5% of a loss or 5% of a profit or after 1 week of holding).. There are no stop losses and take profits when trading like this, there is only time, direction is irrelevant.. Since 2 different markets are involved and the volatility is different I think that 4:1 FTSE : DAX ratio is suitable if my math is correct..

Attached Image (click to enlarge)
Click to Enlarge

Name: MetaTrader 4 IC Markets - DE30 - UK100.png
Size: 36 KB
 
 
  • Post #13
  • Quote
  • Jan 29, 2016 10:05am Jan 29, 2016 10:05am
  •  Tardigrade
  • | Joined Oct 2015 | Status: A Skeptic | 144 Posts
Quoting merquise
Disliked
Neutral to direction.. Looking at DAX-FTSE - correlation of 93.5% (http://www.myfxbook.com/forex-market/correlation) , had you sold FTSE and bought DAX at levels marked, also if you got out at levels indicated you could have been in profit.. So called spread trading, nothing new, you just need to have time frame in mind and profit and loss numbers (like closing with 5% of a loss or 5% of a profit or after 1 week of holding).. There are no stop losses and take profits when trading like this, there is only time, direction is irrelevant.....
Ignored
Neutral to "direction", yes. Then you have to have a strict definition for "direction"; unlike dollar neutral, beta neutral which describe underlying risk exposure, direction neutral is quite vague if not too subjective.

For pure Pair-trading "spreading", yes your strategy could've worked with additional technical rules. For market neutral? Correlation in direction does not guarantee co-movement in distance.

Thanks
No Highs? No Lows? Must be Bose!
 
 
  • Post #14
  • Quote
  • Jan 29, 2016 10:32am Jan 29, 2016 10:32am
  •  merquise
  • | Joined Jun 2014 | Status: Member | 371 Posts
Well neutrality can be a lot of things..to define direction I use moving average. That is my direction, pretty simple and straight forward. The name of the game is risk management, not how to make an omelet without braking a few eggs.

I have been reading about the beta neutral strategies and like every other strategy it induces a level of complexity into a system. For as long as I've known complex systems have a problem with maintenance. When they start to brake down there is nothing you can do about it.

Therefore I opted for a more simplistic approach. In a pair spreading all I care is the level of correlation and the volatility of pairs traded. In my example I first looked at FTSE and made a call that it will fall, but if I am wrong in that call, I will supplement that with long DAX so even if I am wrong my losses won't be huge compared to just directional trade. On top of that the only other thing is volatility, whether something will fall or rise faster than something else.
 
 
  • Post #15
  • Quote
  • Jan 29, 2016 12:19pm Jan 29, 2016 12:19pm
  •  PipMeUp
  • Joined Aug 2011 | Status: Member | 1,305 Posts
Again a high correlation coefficient is not sufficient. Neither is it even necessary!

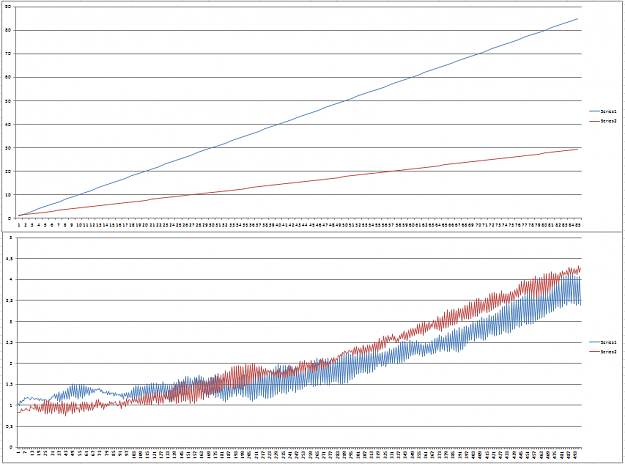
This picture shows two counter examples.
The two series on top have a correlation coefficient of 100%. They will never meet again.
The two series at the bottom are cointegrated per-construction. They have a correlation coefficient of -0.02%.

Attached Image (click to enlarge)
Click to Enlarge

Name: counter_examples.png
Size: 49 KB
No greed. No fear. Just maths.
 
 
  • Post #16
  • Quote
  • Jan 29, 2016 12:33pm Jan 29, 2016 12:33pm
  •  merquise
  • | Joined Jun 2014 | Status: Member | 371 Posts
Is this a real life example or some mathematical model, because with mathematics you can prove anything you want.. Have you been reading about seasonal cycles in futures...spreads in grains for example? Correlation is quite high there and works..
 
 
  • Post #17
  • Quote
  • Jan 29, 2016 12:52pm Jan 29, 2016 12:52pm
  •  GoldTheHun
  • Joined Nov 2014 | Status: Member | 394 Posts
Quoting PipMeUp
Disliked
Again a high correlation coefficient is not sufficient. Neither is it even necessary! This picture shows two counter examples. The two series on top have a correlation coefficient of 100%. They will never meet again. The two series at the bottom are cointegrated per-construction. They have a correlation coefficient of -0.02%. {image}
Ignored

Excellent point. Thank you for the heads up... Very enlightening..
Any suggestions to solve this situation? Maybe slope correlation, or some other method you have in mind...
RandomWalk All Time Return: 10.3%
 
 
  • Post #18
  • Quote
  • Edited 3:11pm Jan 29, 2016 2:31pm | Edited 3:11pm
  •  Tardigrade
  • | Joined Oct 2015 | Status: A Skeptic | 144 Posts
Quoting merquise
Disliked
Is this a real life example or some mathematical model, because with mathematics you can prove anything you want.. Have you been reading about seasonal cycles in futures...spreads in grains for example? Correlation is quite high there and works..
Ignored

merguise

Synthetic or not, PipMeUp's example should be sufficient enough to explain the difference between correlation and cointegration in the most logical manner.

Confusing? Quite so if it is the first time you hear the phrase "cointegration".

Think of it this way:

Correlation---Jim and Kim are racing, they'all strive to be the first to reach the finish line, 10,000 miles straight ahead. Direction-wise they are all going straight forward, yet Jim is a more skillful driver than Kim. It may not make much of a difference first but Jim is distancing himself further and further away from Kim the slow driver, and the distance between them could be arbitrarily long as the race progresses.

Cointegration---If they have similar skill level however, they will take lead in turns and the maximum distance between two cars will not exceed certain amount.
No Highs? No Lows? Must be Bose!
 
 
  • Post #19
  • Quote
  • Jan 29, 2016 2:57pm Jan 29, 2016 2:57pm
  •  merquise
  • | Joined Jun 2014 | Status: Member | 371 Posts
Therefore you want cointegrated-correlated pairs?
 
 
  • Post #20
  • Quote
  • Jan 29, 2016 4:31pm Jan 29, 2016 4:31pm
  •  kprsa
  • Joined Feb 2014 | Status: ember | 1,268 Posts
Quoting PipMeUp
Disliked
The two series at the bottom are cointegrated per-construction. They have a correlation coefficient of -0.02%. {image}
Ignored
Take every tenth point (higher timeframe), your cointegration quality is not going to change, but your correlation coefficient will increase. I am not a mathematician, but it looks to me that the higher the tf you go to (the more you smooth out the wiggles that give you the low correlation) the more you would approach the correlation coefficient of 1.
k
 
 
  • Trading Discussion
  • /
  • Market Neutral Corner
  • Reply to Thread
    • Page 1 2
    • Page 1 2
0 traders viewing now
  • More
Top of Page
  • Facebook
  • Twitter
About FF
  • Mission
  • Products
  • User Guide
  • Media Kit
  • Blog
  • Contact
FF Products
  • Forums
  • Trades
  • Calendar
  • News
  • Market
  • Brokers
  • Trade Explorer
FF Website
  • Homepage
  • Search
  • Members
  • Report a Bug
Follow FF
  • Facebook
  • Twitter

FF Sister Sites:

  • Metals Mine
  • Energy EXCH
  • Crypto Craft

Forex Factory® is a brand of Fair Economy, Inc.

Terms of Service / ©2023