DislikedYes!! This may just be one of those "resetting" times where the correlation goes wacko for a bit, then re-settles into more of that "pendulum" pattern we we are trying to take advantage of.
Even then, there is a give and take between the two pairs, still offering opportunity, if we can identify and manage....
very interesting stuff....
and just as a note, v3.4 still repaints, but the multi-level alarms might be nice!!Ignored
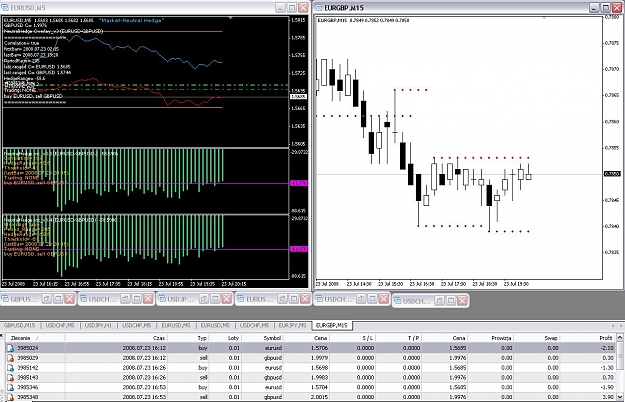
He opened up a long G/J and a short EJ on a demo platform and kept them open..
He watched the "Profit" column to judge when they were out of correlation and traded accordingly.
That's about as simple and direct as you can get. Maybe an indicator that could give a graphic picture of that profit or loss. There would be no repainting. It would be possible to go back historically and determine thresholds.