|
Joined Jul 2006
|
Status: Pay the man ! !
|912 Posts
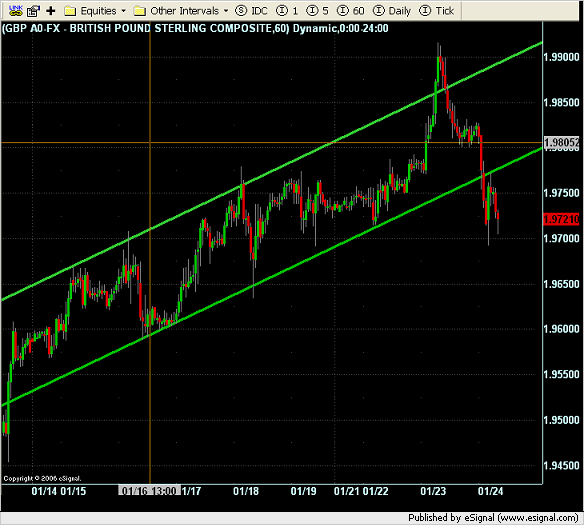
Well the question this morning was which breakout did we believe. The USD/CHF or the GBP/USD.
The winner was the GBP/USD. The GBP/USD extended its breakout 100 pips downword while the USD/CHF crept back up into the consoldation channel. The EUR/USD However still remains in it range channel. This leaves me with the overall view that the dollar is still undecided. And that the pound is primarily weakening due to its own circustances and not by proxy of a strengthening dollar.
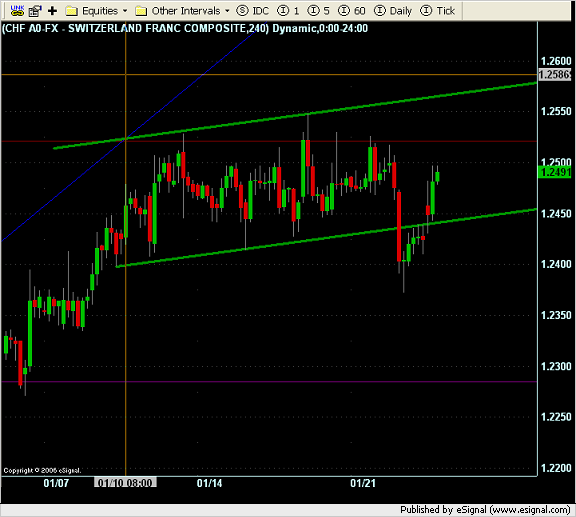
Here are the update charts starting with the USD/CHF
Awesome thread.. lots of good things to learn here. I do have a few questions though.
First of all, in one of the earlier posts you write "I just try to look for correllations where there could be a reaction and try to profit from it." What sort of correlations are those and how to spot them? It would be awesome if you could post some charts explaining this.
Secondly, I'd like to learn more about the projections that you show on some charts a while back. Where would I get any info on that as I have not seen anything on the subject on the web?
My third question is in regard to the murrey math. What is your opinion of it? I do have some material on it, and would like to know what sort of thing I can expect from it from someone who's had experience trading it.
Anyway, I'll be following your thread carefully. Also, I'll try to post some of my own technical analysis charts and hopefully you can review and comment on that. Thanks
Matt
Ignored
Hello Matt,
There is a pretty good description on the origions of and my technique for drawing what I call price channels earlier in the thread.
I don't think you will find anything on the web regarding those price channels. I have not yet seen anyone else draw them like I do outside of this thread.
As for Murrey Math, it is similar to pivot points but not really the same. I find that it provides a nice framework for the market. I particularly find it useful on the 15 minute time frame but people use it on almost any time frame. I have never been formally trained to use murrey math. I use it in my own way. But the readers digest version is that I merely look for behavioral patterns in how the price reacts to different levels. Each currency pair has its own nuances. I would suggest that you put the indicator on your charts and study the indicators relation to price action until you see corrollations that you can capitalize on.
Please do post your charts for discussion that is why I started this thread.
I wish more people would post their t/a charts for discussion. I am kind of surprised that we have not seen any elliot people in here.
In the attached chart, I've drawn some of the resistance/support levels that refer to the shorter time frames (15, 30 min) for intraday trades. The problem I have is there are quite a lot of them and some are really close to each other. How do I go about deciding which ones are major and which ones are less significant? Or do I leave all of them on and just observe which level will the price react to? These are some basic questions, and there is a lot of material on the internet on the subject, and yet I haven't been able to find anything that tells you what to do in such cases.
In the attached chart, I've drawn some of the resistance/support levels that refer to the shorter time frames (15, 30 min) for intraday trades. The problem I have is there are quite a lot of them and some are really close to each other. How do I go about deciding which ones are major and which ones are less significant? Or do I leave all of them on and just observe which level will the price react to? These are some basic questions, and there is a lot of material on the internet on the subject, and yet I haven't been able to find anything that tells you what to do in such cases.
Ignored
hi there,
sorry to intrude, and probably this has been answered before.
I prefer to use at least 60 min timeframes to assess support resistance in the following order
1) swing lows-highs
2) price clusters or price congestion area (i.e. ranges)
3) fibs
4) pivots
5) day-week-month open-closing prices
g
With a break always expect a pullback, otherwise, you're dead meat/
Oh yes, that was the mac daddy GBP/USD trade right there. It is rare that such a good trade is so obvious on the charts. I hope you made good money on that set up.
Thanks for your answer Ghitz,
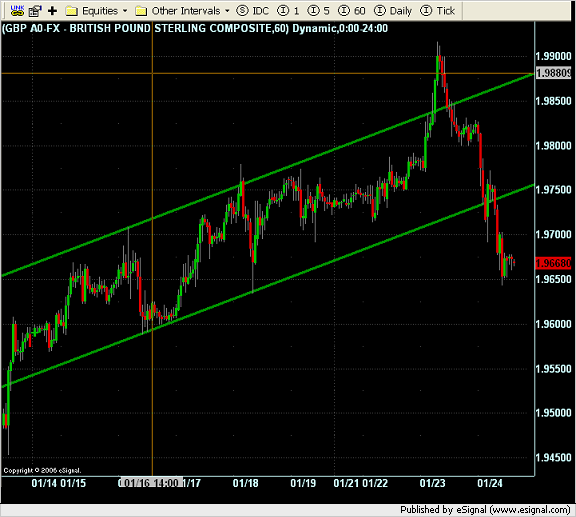
Here's my improved chart. We can see that right now there is some heave resistance 1.9719, and this is also where the pivot point is. Also, it is at the upper channel line. Let me know what you think.
Thanks for your answer Ghitz,
Here's my improved chart. We can see that right now there is some heave resistance 1.9719, and this is also where the pivot point is. Also, it is at the upper channel line. Let me know what you think.
Ignored
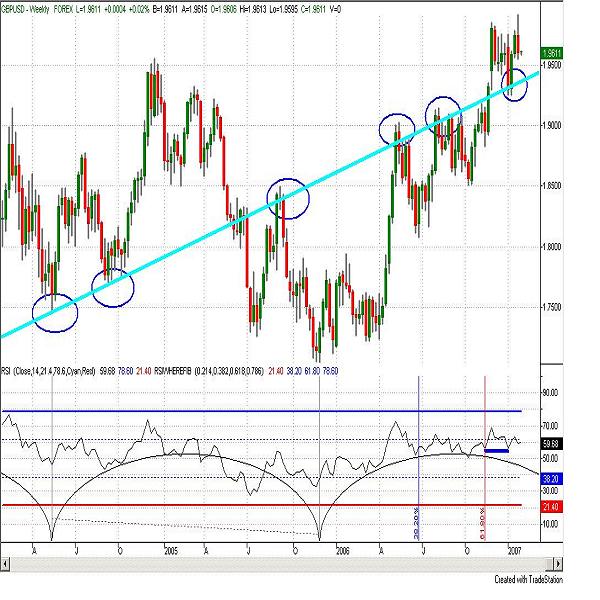
seems like you got it qute right. have a look at this chart. weekly chart. also look at the monthly chart. bar for january is currently a huge spinning top. fibs are from the high to low. put that together with a 4 hr chart. look at swing lows. look at price congestions on 60 mins. look at monthly and weekly open-closing levels, and you got your map.
With a break always expect a pullback, otherwise, you're dead meat/
seems like you got it qute right. have a look at this chart. weekly chart. also look at the monthly chart. bar for january is currently a huge spinning top. fibs are from the high to low. put that together with a 4 hr chart. look at swing lows. look at price congestions on 60 mins. look at monthly and weekly open-closing levels, and you got your map.
Ignored
thanks for the info. just to make sure, you put the fibs from the high to low right? whats the reason for that?
thanks for the info. just to make sure, you put the fibs from the high to low right? whats the reason for that?
Ignored
no reason. could be the otherway around, unless you are looking at extensions. i am looking at a range defined by that spinningtop, so it doesnt matter.
g
With a break always expect a pullback, otherwise, you're dead meat/
|
Joined Jul 2006
|
Status: Pay the man ! !
|912 Posts
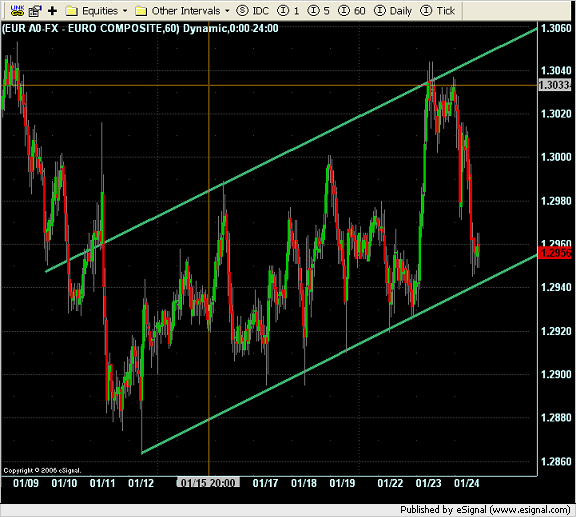
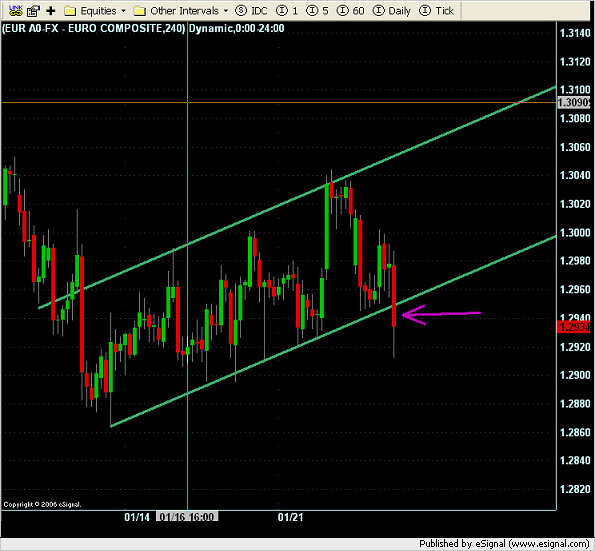
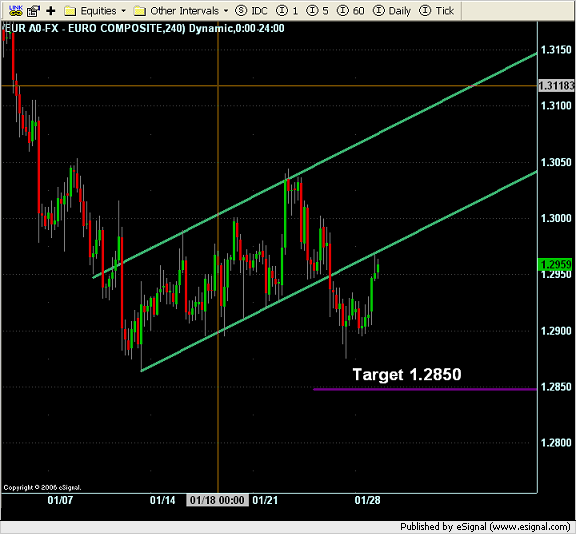
Here is an updated chart with thursday euro bear flag break out.
Typical the target for such a break out would be the width of the channel. The width of the channel in this case was 100 pips. As you can see on the chart below the target would have been 1.2850 Thursdays breakout achieved a low of about 1.2880. While this trade was by no means a loser, it was a weak breakout. As a note, I will state that I typically move my stops to break even as soon as the trade clears 25+ pips to the positive with my initial stop usually being the midriff of the break out candle and no more that about 23 pips.