• Home
  • Forums
  • Trades
  • News
  • Calendar
  • Market
  • Brokers
  • Login
  • Join
  • User/Email: Password:
  • 7:53am
Menu
  • Forums
  • Trades
  • News
  • Calendar
  • Market
  • Brokers
  • Login
  • Join
  • 7:53am
Sister Sites
  • Metals Mine
  • Energy EXCH
  • Crypto Craft

Options

Bookmark Thread

First Page First Unread Last Page Last Post

Print Thread

Similar Threads

The 4 Hour Fozzy Method 233 replies

FOZZY Method CROSSES 808 replies

Fozzy Alt... one more approach to the Daily Fozzy Method 40 replies

My Daily Fozzy Trades 337 replies

Monthly Fozzy Method 9 replies

  • Trading Systems
  • /
  • Reply to Thread
  • Subscribe
  • 343
Attachments: The Daily Fozzy Method
Exit Attachments

The Daily Fozzy Method

  • Last Post
  •  
  • 1 7677Page 787980 141
  • 1 Page 78 141
  •  
  • Post #1,541
  • Quote
  • Jan 16, 2007 7:27am Jan 16, 2007 7:27am
  •  BeachBum
  • Joined Oct 2005 | Status: Trade the MAX System with me... | 1,995 Posts
Sometimes.................

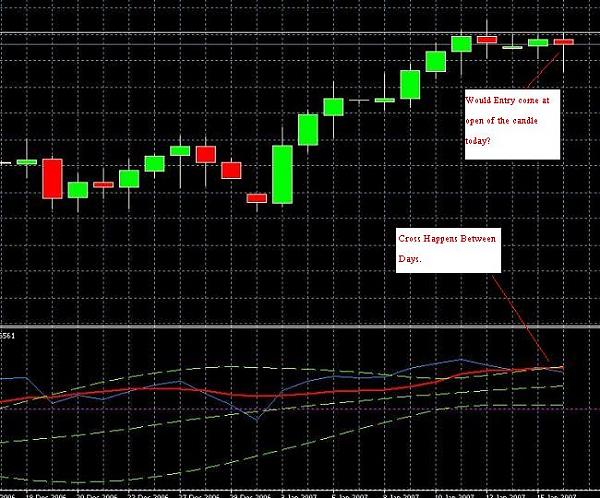
To become familiar with how it reacts to price change, try a forward test by either marking your chart each time the color changes as it crosses the "0" line and then observing the results or take a "screenshot" everyday for the same analysis. This indicator is useful with this method when applied as discussed earlier in this thread. When used on smaller time frames and charts, it will often give false signals because it repaints. Although I have found interesting results when used on a 4 hour chart.


Quoting willf
Disliked
Doesn't the Solar Wind repaint itself when a new bar opens?

It always looks good backtesting but forward testing the current bar can change depending on the next bar.
Ignored
 
 
  • Post #1,542
  • Quote
  • Jan 16, 2007 1:55pm Jan 16, 2007 1:55pm
  •  migamb
  • | Joined May 2006 | Status: Still Learning | 77 Posts
I ran into this thread and was interested in the system so I started reading through this long thread. I donwloaded the EA on the other thread and ran the MT4 analyzer from 1/2004 to 1/2007 and I got this:

Bars in test 2052
Ticks modelled 28206
Modelling quality 50.00%
Initial deposit 10000.00
Total net profit 31628.66
Gross profit 106373.61
Gross loss -74744.95
Profit factor 1.42
Expected payoff 140.57
Absolute drawdown 0.00
Maximal drawdown 11356.11 (33.07%)
Relative drawdown 33.07% (11356.11)
Total trades 225
Short positions (won %) 116 (78.45%)
Long positions (won %) 109 (74.31%)
Profit trades (% of total) 172 (76.44%)
Loss trades (% of total) 53 (23.56%)
Largest
profit trade 2601.19
loss trade -2400.00
Average
profit trade 618.45
loss trade -1410.28
Maximum
consecutive wins (profit in money) 20 (10095.95)
consecutive losses (loss in money) 4 (-4761.24)
Maximal
consecutive profit (count of wins) 10095.95 (20)
consecutive loss (count of losses) -5280.00 (3)
Average
consecutive wins 5
consecutive losses 1

This looks fairly impressive. I know the tester in Mt4 does not have a good reputation but have seen other systems tested and the results from MT4 posted as proof. Has anyone tested this manually and received similar results?
 
 
  • Post #1,543
  • Quote
  • Jan 16, 2007 2:43pm Jan 16, 2007 2:43pm
  •  BeachBum
  • Joined Oct 2005 | Status: Trade the MAX System with me... | 1,995 Posts
migamb.............I know there's a lot to read in this thread, but if you take the time and at least "look" at all the posts, your question will evaporate. You'll learn all you need to know about this method and will probably start trading it profitably like many of us already do. (Take a look at my posted results from last Fall)


Quoting migamb
Disliked
I ran into this thread and was interested in the system so I started reading through this long thread. I donwloaded the EA on the other thread and ran the MT4 analyzer from 1/2004 to 1/2007 and I got this:

Bars in test 2052
Ticks modelled 28206
Modelling quality 50.00%
Initial deposit 10000.00
Total net profit 31628.66
Gross profit 106373.61
Gross loss -74744.95
Profit factor 1.42
Expected payoff 140.57
Absolute drawdown 0.00
Maximal drawdown 11356.11 (33.07%)
Relative drawdown 33.07% (11356.11)
Total trades 225
Short positions (won %) 116 (78.45%)
Long positions (won %) 109 (74.31%)
Profit trades (% of total) 172 (76.44%)
Loss trades (% of total) 53 (23.56%)
Largest
profit trade 2601.19
loss trade -2400.00
Average
profit trade 618.45
loss trade -1410.28
Maximum
consecutive wins (profit in money) 20 (10095.95)
consecutive losses (loss in money) 4 (-4761.24)
Maximal
consecutive profit (count of wins) 10095.95 (20)
consecutive loss (count of losses) -5280.00 (3)
Average
consecutive wins 5
consecutive losses 1

This looks fairly impressive. I know the tester in Mt4 does not have a good reputation but have seen other systems tested and the results from MT4 posted as proof. Has anyone tested this manually and received similar results?
Ignored
 
 
  • Post #1,544
  • Quote
  • Jan 16, 2007 3:23pm Jan 16, 2007 3:23pm
  •  migamb
  • | Joined May 2006 | Status: Still Learning | 77 Posts
The USDCHF seems to have an entry coming in today. Here is the chart. Am I correct that on the open of today's candle would be the entry since the cross happened between today's and yesterday's candle?

http://forexfactory.com/attachment.p...1&d=1168978918
Attached Image
 
 
  • Post #1,545
  • Quote
  • Jan 16, 2007 3:51pm Jan 16, 2007 3:51pm
  •  howard
  • | Joined Sep 2006 | Status: howard | 1,679 Posts
Quoting migamb
Disliked
The USDCHF seems to have an entry coming in today. Here is the chart. Am I correct that on the open of today's candle would be the entry since the cross happened between today's and yesterday's candle?

http://forexfactory.com/attachment.p...1&d=1168978918
Ignored

If the cross is confirmed by today's close, you will enter at the open of tomorrow, as I write the cross is appearing and disappearing.

There are other variations of the method, for example one is to wait for the coss of 50 level line to trigger a trade.
Regards
 
 
  • Post #1,546
  • Quote
  • Jan 16, 2007 3:58pm Jan 16, 2007 3:58pm
  •  summitfx
  • | Additional Username | Joined Jun 2006 | 787 Posts
My experience with trading and following this method is to avoid crosses when the lines are "hugging" which is the case with the UC. It does seems like this pair is ready for a retracement. I like sharp angles with my fozzies.
Trade what you see - Not what you think
 
 
  • Post #1,547
  • Quote
  • Jan 16, 2007 5:08pm Jan 16, 2007 5:08pm
  •  migamb
  • | Joined May 2006 | Status: Still Learning | 77 Posts
After doing more research I noticed I had the 8MA set as simple and saw that it needed to be exponential. This takes the cross away. Thanks for the feedback, I like this method so far.
 
 
  • Post #1,548
  • Quote
  • Jan 16, 2007 8:57pm Jan 16, 2007 8:57pm
  •  migamb
  • | Joined May 2006 | Status: Still Learning | 77 Posts
I read many posts with people using SMA and others using EMA for the 8 MA period. The people that have tested which one is more accurate? Just asking because there seems to be a substantial difference between the two.
 
 
  • Post #1,549
  • Quote
  • Jan 17, 2007 5:19pm Jan 17, 2007 5:19pm
  •  fukinagashi
  • | Joined Apr 2006 | Status: King of Fools | 153 Posts
Some forward testing 06th december until today
Attached Images
 
 
  • Post #1,550
  • Quote
  • Jan 17, 2007 6:24pm Jan 17, 2007 6:24pm
  •  freemark
  • | Joined Mar 2006 | Status: Junior Junior | 11 Posts
migamb brings up a good question: SMA or EMA?
my question is: is the MA applied to the Open, Close, or which? I notice it makes a big difference in the charting of the line, the angle.

I have not found this detail in any of the FOZZY threads and would appreciate it if you could share this detail of your setup with everybody.

thanks to all for a fantastic set of threads -

go fozzy!
Just Trade.
 
 
  • Post #1,551
  • Quote
  • Jan 17, 2007 6:35pm Jan 17, 2007 6:35pm
  •  forexdanofsa
  • | Joined Oct 2006 | Status: DAVLO | 72 Posts
Yes

i would like to know also if we are to use the simple or the exponential ma?
Thanks for such a great system, i've been incorporating Steviets system with this one and I am getting great results with catching and riding trends and minimizing my losses.

Dave
 
 
  • Post #1,552
  • Quote
  • Jan 17, 2007 7:11pm Jan 17, 2007 7:11pm
  •  willf
  • | Joined May 2006 | Status: Yipppppppeeeeee ! | 847 Posts
Quoting freemark
Disliked
migamb brings up a good question: SMA or EMA?
my question is: is the MA applied to the Open, Close, or which? I notice it makes a big difference in the charting of the line, the angle.

I have not found this detail in any of the FOZZY threads and would appreciate it if you could share this detail of your setup with everybody.

thanks to all for a fantastic set of threads -

go fozzy!
Ignored
In the earlier posts of this thread Fozzy says he uses EMA applied to the RSI (First Indicators Data).
Attached Image
 
 
  • Post #1,553
  • Quote
  • Jan 17, 2007 7:17pm Jan 17, 2007 7:17pm
  •  fresian
  • | Joined Nov 2006 | Status: Member | 159 Posts
I am still pretty green at using the Fozzy system but have read through the thread a few times and believe that the original Fozzy uses the EMA applied to the close (Fozzy or BeachBum might want to confirm this as long time users). This is the MA I am using and a number of others are using. Earlier on some people had talked of using the SMA, and maybe there are people using that....what works for some doesn't for others. There's also going to be differences depending on your datefeed.

Best of trading with the Fozzy!
 
 
  • Post #1,554
  • Quote
  • Jan 17, 2007 7:20pm Jan 17, 2007 7:20pm
  •  fresian
  • | Joined Nov 2006 | Status: Member | 159 Posts
You beat me to it willf....at least our answers were consistent and haven't confused anyone!
 
 
  • Post #1,555
  • Quote
  • Jan 17, 2007 7:27pm Jan 17, 2007 7:27pm
  •  freemark
  • | Joined Mar 2006 | Status: Junior Junior | 11 Posts
thanks, willf,
Just Trade.
 
 
  • Post #1,556
  • Quote
  • Jan 17, 2007 11:23pm Jan 17, 2007 11:23pm
  •  salpoe
  • | Joined Oct 2006 | Status: Member | 13 Posts
Quoting willf
Disliked
In the earlier posts of this thread Fozzy says he uses EMA applied to the RSI (First Indicators Data).
Ignored
the RSI does not have that option...did you mean the MA was optioned for Exponential? I assume so. Thanks
carpe dium
 
 
  • Post #1,557
  • Quote
  • Jan 18, 2007 3:53am Jan 18, 2007 3:53am
  •  jtrade
  • Joined Feb 2006 | Status: Member | 1,372 Posts
Suggest anyone with this question reads accrete's post #9.

But it really doesn't matter... sometimes the signal will be the same, sometimes a day earlier or later, sometimes one will keep you out of a whipsaw and vice versa.

What does matter is being clear on your rule set and sticking to it.


J.
 
 
  • Post #1,558
  • Quote
  • Jan 18, 2007 9:22am Jan 18, 2007 9:22am
  •  BeachBum
  • Joined Oct 2005 | Status: Trade the MAX System with me... | 1,995 Posts
IMO............THIS is the most important rule of Fozzy trading!


Quoting jtrade
Disliked
What does matter is being clear on your rule set and sticking to it.


J.
Ignored
 
 
  • Post #1,559
  • Quote
  • Jan 18, 2007 11:37pm Jan 18, 2007 11:37pm
  •  Lamdun
  • | Joined Dec 2006 | Status: Fundamental Technical Trader | 118 Posts
Hey fellow fozzy traders. I've been trading a slight alteration of willf's fozzy system and I've been getting nice results so i thought I should share.

Very simple.

If the trade follows willf's then just follow willf's directions.

However, if the RSI crosses the MA and is NOT on the correct side of the 50 level, I will enter 1 lot with TP at the next fib line that is at least 20 pips away. However, if within two days, per willf's method the RSI crosses the 50 level, then I add 2 more lots with his same exit strategy.

For SL I either use the ATR or yesterday's low. This is discretionary based on market conditions. With one exception: if my first (non-willf) lot has a TP that is less than either the ATR or the daily low, I set the SL so I get a R:R of 1:1

I love the winning percentage of willf's 50 level filter and that is why I use 2 lots on that. However, I felt that even when the RSI isnt on the right side of the 50, the winning percentage is still large enough to justify an earlier entry of one lot.

Actually, to be honest, i made this alteration because I hit myself in the head many times when waiting for the RSI to cross the 50 and watching large amounts of potential profits go to waste. It's probably not a great reason, but adding the early entry rule relieved some of my stress, which is a huge help even if it isn't more profitable (though as of now, it is)

I don't have any backtest results on this and I do not plan to do extensive backtesting anytime in the near future, so please don't ask for any. All I know is that this method has been successful for me.
 
 
  • Post #1,560
  • Quote
  • Jan 19, 2007 7:35am Jan 19, 2007 7:35am
  •  migamb
  • | Joined May 2006 | Status: Still Learning | 77 Posts
Fellow traders, I was looking for the indicator that puts the arrow on the candle we should buy/sell, I only found the indicator that shows the line going to 0 or 100 to signify the buy/sell. Can someomen point me to were I can get this indicator? Thanks.
 
 
  • Trading Systems
  • /
  • The Daily Fozzy Method
  • Reply to Thread
    • 1 7677Page 787980 141
    • 1 Page 78 141
0 traders viewing now
  • More
Top of Page
  • Facebook
  • Twitter
About FF
  • Mission
  • Products
  • User Guide
  • Media Kit
  • Blog
  • Contact
FF Products
  • Forums
  • Trades
  • Calendar
  • News
  • Market
  • Brokers
  • Trade Explorer
FF Website
  • Homepage
  • Search
  • Members
  • Report a Bug
Follow FF
  • Facebook
  • Twitter

FF Sister Sites:

  • Metals Mine
  • Energy EXCH
  • Crypto Craft

Forex Factory® is a brand of Fair Economy, Inc.

Terms of Service / ©2022