• Home
  • Forums
  • Trades
  • News
  • Calendar
  • Market
  • Brokers
  • Login
  • Join
  • User/Email: Password:
  • 9:46pm
Menu
  • Forums
  • Trades
  • News
  • Calendar
  • Market
  • Brokers
  • Login
  • Join
  • 9:46pm
Sister Sites
  • Metals Mine
  • Energy EXCH
  • Crypto Craft

Options

Bookmark Thread

First Page First Unread Last Page Last Post

Print Thread

Similar Threads

The Daily Fozzy Method 2,814 replies

The 4 Hour Fozzy Method 233 replies

FOZZY Method CROSSES 808 replies

My Daily Fozzy Trades 337 replies

Monthly Fozzy Method 9 replies

  • Trading Systems
  • /
  • Reply to Thread
  • Subscribe
  • 10
Attachments: Fozzy Alt... one more approach to the Daily Fozzy Method
Exit Attachments

Fozzy Alt... one more approach to the Daily Fozzy Method

  • Last Post
  •  
  • Page 1 2 3
  • Page 1 2 3
  •  
  • Post #1
  • Quote
  • First Post: Edited at 7:12pm Oct 5, 2006 7:01pm | Edited at 7:12pm
  •  miscon777
  • | Joined Aug 2006 | Status: Member | 33 Posts
Fozzy's done a good job of describing his system, which is an offshoot of the Dynamic RSI system. I highly recommend reading his description if you have not.

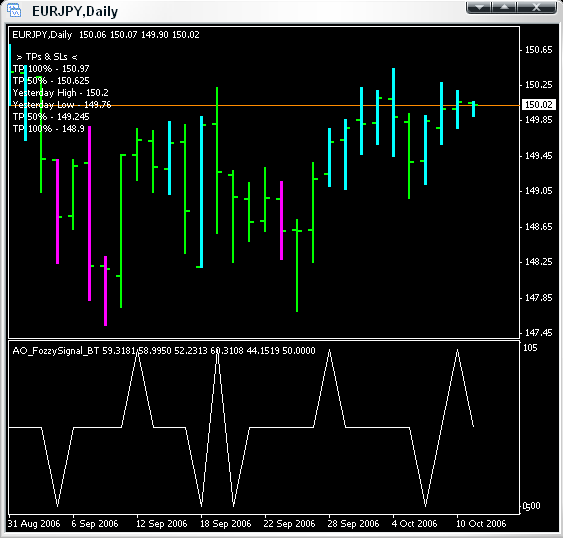
My summation: an 8 Period RSI is plotted with an 8 period MA of that RSI on a daily chart. When the RSI crosses its MA either up or down, its considered a buy or sell signal. You wait until the day that the signal was generated is done before placing any orders - ie, you don't place an order just because a cross starts to appear, you wait for it to solidify and take action at the start of the next day.

Fozzy's orginal rules also includes plotting Bollinger Bands of the RSI and only taking buy signals that develop below the middle BB line, as well as only taking sell signals that develop above the middle BB line. Though I respect Fozzy's opinion and research, my own research thus far points me towards not employing this BB filter. The indicators that I will attach (most likely in a later post), do show the BBs for those who wish to observe Fozzy's filter.

This is a DAILY system. It hasn't been tested on smaller timeframes (by me, anyway). I have no idea if it would work well or not on smaller timeframes. The reason that I (and Fozzy as well) use these similar systems is that we've got day jobs and can't sit around watching charts all day. The idea is that this system allows you to check in at 0:00 GMT, place your market orders for the day (if any signals have developed), and walk away.

Its my opinion that any such 'fire-and-forget' system is, by default, crippled. Basically I'm trying to make the best of a bad situation. Backtesting this system on GBPUSD since the beginning of 2006 showed good results (I'll post the exact results later), so I'm forward testing it.

I'm not advocating this method. This is a research project. As I've said before, let's have an intelligent, respectful conversation, and educate each other.
Et ecce equus pallidus...
  • Post #2
  • Quote
  • Oct 5, 2006 7:10pm Oct 5, 2006 7:10pm
  •  miscon777
  • | Joined Aug 2006 | Status: Member | 33 Posts
Thie following is a near word-for-word post of a post I submitted in the thread on Fozzy's Daily trading system. It gives more detail on how I set entry, SL, and TP levels in the system. I've also attached the two indicators I built for the system.

This is a 1:1 risk/reward system involving two lots. Instead of automatically entering at the opening of the day following a crossover, I set my entry at the previous day's high (or low if sell signal was given). I do this because I see it as a confirmation of the intended trade, and in my backtesting it repeatedly kept me out of trades that were blatently bad (when the price went exactly the opposite direction that was predicted).

So, I place an order for one lot at the previous days high with an SL of the previous day's low and a TP equal to the gap between yesterday's high and low (so SL gap = TP gap, or 1:1 risk/reward).

I then place a second order with an entry at the same level as the first, but I divide yesterday's high/low range in half and use that to determine my SL and TP for that order... again, SL gap = TP gap, but this time only half of the previous day's range.

To sum up, I'm waiting for today's price to hit yesterday's extreme, and then setting one order with a SL and TP of yesterday's range, and a second order with a SL and TP of 50% of yesterday's range.

If the 50% range order's TP is hit, I move the 100% range order to break even.

Here's the funk-a-fyer: As days pass and orders remain open, I re-adjust my SLs and TPs based on the day that has just passed. Basically, I built an indicator that shows me the 50% and 100% SL/TP levels as they change each day, which makes it pretty easy.

The cardinal rule in moving SLs and TPs as day pass is that the SL gaps never get increased, no matter what... the TP gap might increase (which happens when day after day the trade is going in your direction), but the SL is never increased (in terms of gap), even if the new day's level indicates that it should. As an example, if you were long and a new day presented a new SL that would be lower than your current SL, you keep your old SL and disregard the new one.

Many of the trades I saw in backtesting were stopped out by their SL... but after three or four days of climbing up and up, and often at a very good profit. Meanwhile, as the TPs increase, you stay in the trade and hope that the trend you've caught continues.

Next up I'll post some chart images of real trades to clarify the above.
Attached File
File Type: zip AO_FozzyAlt_indicators.zip   2 KB | 3,252 downloads
Et ecce equus pallidus...
 
1
  • Post #3
  • Quote
  • Oct 5, 2006 8:00pm Oct 5, 2006 8:00pm
  •  miscon777
  • | Joined Aug 2006 | Status: Member | 33 Posts
OK, so an example from a few days ago...

A buy signal developed on the USDCAD on 10/02/2006. Note that my AO_Fozzy_BT indicator is built to show you a green spike on the day you should place orders. So, basically that green spike on 10/02/2006 is saying that a confirmed crossover happened on 10/01. You can see this on the first image (red line in the indicator is the RSI, blue line the RSI's MA).

So, at (or close to) 0:00GMT, I placed two buy stop market orders at the previous day's high (1.1188). The first order is my '100% order,' where the SL is set at the previous day's low (1.1100), and the TP is set to equal the number of pips between the prev day's hi and low (1.1188 hi minus 1.1100 = 88 pips... 1.1188 entry level + 88 pips = 1.1276). The second order - my '50% order' - works similiarly, but divides the prev range in half (88 pip range / 2 = 44 pips). The resulting SL is set at 1.1144, and the TP is 1.1232.

The next image steps down to the hourly chart and shows the following three days or so. I don't use the hourly chart to trade, but it makes the action a bit more clear for this example. The horizontal lines shown are produced by my "AO_YestHiLow2Lot" indicator, attached above.

Day 1's levels have been described. Note that the entry level for both orders was entered about 1/3rd of the way through the day, and near the end of the day the 50% SL was very nearly hit... but it eeked by.

Near 0:00GMT on Day 2, I checked in on the trade to alter my SLs and TPs. The 100% SL (Day 1's low) increased a good amount... which made me feel good because it appeared the price could continue down, so at least my losses would be limited. Note that the price was actually below the new 50% SL line. This happens relatively often, and basically I handle this by either just keeping yesterday's SL or by setting the new 50% SL at the 100% SL level... whichever looks better to my eye. In this case, they were very close, so I just set both to the 100% SL.

TPs for both 50% and 100% orders were set at the new levels shown.

On Day 3 I checked in around 0:00GMT again. Lucky me! The trade started to climb again! This time it was easy to break the two SLs out to their normal levels again (as the price was once again above both), so I did that. I moved the two TPs up once again to match the levels shown.

Near halfway through the day on Day 3 the 50% TP was hit at 1.1263 - about 30 pips more (or double) the original 50% TP. I was occasionally checking in from work, so I moved the 100% order up to its original break-even level (1.1188). Several hours later the 100% TP was also hit at 1.1302 - again, about 30 pips higher than the original TP for that order (~50% more).

So... there you have it. Hopefully what this demonstrates the 'stepping' nature of the system... if the trade is going your way, the TPs increase to let it run. Every time this happens, your initial risk/reward ratio improves. Meanwhile if it completely goes against you, your worst R:R is 1:1... generally a sustainable (though not optimal) ratio. As I've stated previously, many times a trade will be stopped out after a few days of it going in your direction... but at that point the SL is often a good bit higher than your entry level anyway.

The important thing I want to stress again is that no matter what the indicators say you don't ever increase the amount of your SL (in terms of gap). Assuming you are in a long trade, if the indicators tell you that the 50% SL line is now lower than it was yesterday, you ignore it and keep yesterday's SL for today. The reason is that generally this shows that the action is going against you, and chances are good you want to stopped out sooner.
Attached Images
Et ecce equus pallidus...
 
1
  • Post #4
  • Quote
  • Oct 6, 2006 3:42pm Oct 6, 2006 3:42pm
  •  Triton18
  • | Joined Feb 2006 | Status: Member | 39 Posts
Thanks a lot, miscon, great work!

Now I have understood the virtues of your money management rules.

I am going now to backtest visually, with an eye to 4H charts as well. I was used to 64 ticks charts, so not so easy for me to think in terms of daily bars.

You said that daily trading is crippled from starting, but as often it is a double edged sword: being far from the screens can save you from some bad interventions (and too many emotions![img]images/icons/icon12.gif[/img])
 
 
  • Post #5
  • Quote
  • Oct 6, 2006 4:56pm Oct 6, 2006 4:56pm
  •  Triton18
  • | Joined Feb 2006 | Status: Member | 39 Posts
Miscon, is there a way to get an email triggered by your indicator when there is a cross?

It could be VERY useful....
 
 
  • Post #6
  • Quote
  • Oct 7, 2006 12:26pm Oct 7, 2006 12:26pm
  •  BeachBum
  • Joined Oct 2005 | Status: Trade the MAX System with me... | 1,995 Posts
miscon.........

Please keep us informed as to how this works out for you. Posting your results would be greatly appreciated.
 
 
  • Post #7
  • Quote
  • Oct 8, 2006 7:50pm Oct 8, 2006 7:50pm
  •  HighAsAKite
  • | Joined Aug 2006 | Status: Member | 26 Posts
Yes Please do keep us informed on how this alternative method goes. I would like to know the results.


Cheers,
Ride it like you stole it! Life begins at 25 Knots!
 
 
  • Post #8
  • Quote
  • Oct 10, 2006 1:49pm Oct 10, 2006 1:49pm
  •  miscon777
  • | Joined Aug 2006 | Status: Member | 33 Posts
If I can ever find the time, I'll build a custom backtester for this strategy. For now, I'll post my results as they come in... probably in week intervals, or thereabouts.

So, for the past seven days of trading (no trading on sat or sun):

10/02/06: USDCAD 50% Lot: 58 pips
10/02/06: USDCAD 100% Lot: 91 pips
10/05/05: GBPUSD - entry levels not achieved
10/05/06: USDCHF 50% Lot: 38 pips
10/05/06: USDCHF 100% Lot: 60 pips
10/09/06: EURUSD 50% Lot: 55 pips
10/09/06: EURUSD 100% Lot: still open, currently +51 pips, SL at BE
10/10/06: AUDUSD: 50% Lot: -24 pips
10/10/06: AUDUSD: 100% Lot: still open, currently -18 pips
10/10/06: USDJPY: 50% Lot: -18 pips
10/10/06: USDJPY 100% Lot: 37 pips

TOTAL: 297 pips, not including current open orders... not bad for seven days of setting and forgetting... a total of perhaps 1 hour of work.

Notes:

For some reason a market order on GBPUSD that should have opened on 10/09/06 never did... it just vanished from my trading platform. No idea why.

10/9/06 had amazingly low ranges across most currencies, perhaps due to the Columbus Day holiday in the US. The end effect was very tight SLs on the trades entered 10/10 (see above). I was reticent to enter these trades, knowing that less than a 30 pip SL could easily stop out the 50% lot orders just through the 'random walk' of daily trading... but in the interest of sticking to the system I entered anyway. Turns out I was right - the 50% Lot on USDJPY was stopped out, while the 100% later achieved its TP. The AUDUSD can't really be judged yet, as the 100% Lot is still in play. I might consider adding a rule that if a 50% SL is less than 30 pips, the trade should not be entered... but I'll have to wait and see if and when this comes up again.

So far I've noticed that it usually takes two or three days for orders to close out. Often the first day that a trade is entered the price goes against the trade... but by the second or third it has turned back in your favor.

The numbers of pips I've noted above include swaps, spreads, etc - these are the final numbers that I've got in my account from forward testing.

-miscon777
Et ecce equus pallidus...
 
 
  • Post #9
  • Quote
  • Oct 10, 2006 2:41pm Oct 10, 2006 2:41pm
  •  Triton18
  • | Joined Feb 2006 | Status: Member | 39 Posts
Interesting post, miscon.

Indeed, it seems I have troubles, since trades are different.

Please, would you check a couple of charts of mine, and tell me about differences, or post yours same?

TIA
Attached Images
 
 
  • Post #10
  • Quote
  • Edited at 4:53pm Oct 10, 2006 4:47pm | Edited at 4:53pm
  •  lietuve
  • | Joined Nov 2005 | Status: Member | 437 Posts
Hi miscon777!
I am from an old fashioned mainframe programming background. 50:50 - that's the way we used the SORT in Cobol. The easiest way for me to sort the trades also. So I've been playing with the idea until now, manually backtesting, forward testing, but, the losses in a ranging markets were too big, so I tried to adjust 50:50 sort with every new H or L, which worked, but I would be taken out of the good trades prematurely. Never thought about including a second trade. What a nice thinking. Congratulations. Now I am going to test it your way.
Thanks a lot.

BTW I am not using Fozzy. A LWMA(2) and LWMA(10) does the trick for me.
 
 
  • Post #11
  • Quote
  • Oct 10, 2006 9:43pm Oct 10, 2006 9:43pm
  •  Skyhook
  • | Joined Sep 2006 | Status: Elevating the way to success | 585 Posts
Hey there Miscon, et all, I just wanted to post up my slightly modified copy of the indicator. It is now set up to give you a print-out on the chart itself of your entries and exits instead of an excrutiating number of lines. See screen-shot for a preview.

Working on the EA side of things now, will post when I clear it up (could be a while, lol).
Attached Image
Attached File
File Type: mq4 Sky_FozAlt_Print.mq4   4 KB | 1,454 downloads
 
 
  • Post #12
  • Quote
  • Oct 11, 2006 8:29am Oct 11, 2006 8:29am
  •  BeachBum
  • Joined Oct 2005 | Status: Trade the MAX System with me... | 1,995 Posts
Hello lietuve.....

Would you mind elaborating on how you use the LWMA(2) and LWMA(10)?
Thanks!

Quoting lietuve
Disliked
Hi miscon777!
BTW I am not using Fozzy. A LWMA(2) and LWMA(10) does the trick for me.
Ignored
 
 
  • Post #13
  • Quote
  • Oct 11, 2006 10:14pm Oct 11, 2006 10:14pm
  •  cisco
  • Joined Sep 2006 | Status: Member | 2,228 Posts
Miscon777, could you explain the term "swaps?" I'm not familiar with it. Thanks.
Hi, my name is Barry and you can keep your doctor...
 
 
  • Post #14
  • Quote
  • Oct 11, 2006 10:47pm Oct 11, 2006 10:47pm
  •  miscon777
  • | Joined Aug 2006 | Status: Member | 33 Posts
Thanks for all the replies and input, folks. Been tied up and not able to respond, but I hope to soon.

One quick one:

Cisco, 'swaps' are the interest that brokers charge you if you hold from one day to another. I believe most charge this interest at the switch of 0:00 GMT. My experience has been its not too painful... but in a system where you end up holding a trade for several days it does affect the bottom line.

I'll get back to the rest as soon as I can.


-miscon777
Et ecce equus pallidus...
 
 
  • Post #15
  • Quote
  • Oct 12, 2006 3:43am Oct 12, 2006 3:43am
  •  Skyhook
  • | Joined Sep 2006 | Status: Elevating the way to success | 585 Posts
Quoting miscon777
Disliked
Cisco, 'swaps' are the interest that brokers charge you if you hold from one day to another. I believe most charge this interest at the switch of 0:00 GMT. My experience has been its not too painful... but in a system where you end up holding a trade for several days it does affect the bottom line.
-miscon777
Ignored
Swaps are the interest differences charged/credited per each day of holding a position. Swaps are always incurred at the end of each trading day, IE, 5PM EST when NY closes. Swaps on mini accounts aren't really much to worry about, but a daily swap amount on a GBP/JPY trade for instance can amount to something like $20-30USD a day per standard lot. Swaps are the difference in interest rates applied towards your amount of currency held, with swap paid out if you are holding the lower interest currency of the pair, and swap earned if you are holding the higher interest rate currency of the pair. The more currency you're holding in your trade, the larger the swap paid/earned. Swap is always paid out triple on Wednesday to catch up for the lag that is incurred from the non-business days of Saturday and Sunday. Just because we here in 'mericuh can trade on Sunday evenings is due to the fact that the market's open because it's Monday morning in Tokyo and Sydney, so don't let that trip you up.

If I left anything out, or mistyped something, please fill it in.
 
 
  • Post #16
  • Quote
  • Oct 12, 2006 9:13am Oct 12, 2006 9:13am
  •  cisco
  • Joined Sep 2006 | Status: Member | 2,228 Posts
Miscon777, Skyhook, Thanks for the explanation. My broker just calls it "premium." I knew how it worked, I just wasn't familiar with the term "swaps."
Hi, my name is Barry and you can keep your doctor...
 
 
  • Post #17
  • Quote
  • Oct 12, 2006 9:33am Oct 12, 2006 9:33am
  •  tammy
  • | Joined Aug 2006 | Status: Member | 2 Posts
Hi Miscon777, Thanks very much for sharing your way of trading the Fozzy System. I was a little confused about the time zones. I am in Central Time and I'm on FXDD. When it's 16:00 here a new bar starts on the daily chart on FXDD but that's not GMT 00:00. Do i just go by midnight on my broker and check for a trade around 16:00 my time and using the previous days bar as my t/p and s/l? Thanks
 
 
  • Post #18
  • Quote
  • Oct 12, 2006 11:30am Oct 12, 2006 11:30am
  •  Triton18
  • | Joined Feb 2006 | Status: Member | 39 Posts
I'll try to post here the trades I see on my charts, on the purpose to compare them with others, and to see if I missed something or did wrong reading of the charts. All trades live, but I am not posting exact levels because I am using sligthly different values.

While writing, 11.35 EST, I have been stopped on the 50% lot, the first one still open.
 
 
  • Post #19
  • Quote
  • Oct 13, 2006 12:25am Oct 13, 2006 12:25am
  •  Dreamliner
  • Joined Oct 2006 | Status: Member | 2,271 Posts
Skyhook, thank you for this indicator; much better. However, the writing is very small and hard to read (either that or I'm going blind ) and I wonder if there is a way to make them big, bold and easily readable.


Quoting Skyhook
Disliked
Hey there Miscon, et all, I just wanted to post up my slightly modified copy of the indicator. It is now set up to give you a print-out on the chart itself of your entries and exits instead of an excrutiating number of lines. See screen-shot for a preview.

Working on the EA side of things now, will post when I clear it up (could be a while, lol).
Ignored
 
 
  • Post #20
  • Quote
  • Oct 13, 2006 1:16am Oct 13, 2006 1:16am
  •  Skyhook
  • | Joined Sep 2006 | Status: Elevating the way to success | 585 Posts
Quoting mikejody
Disliked
Skyhook, thank you for this indicator; much better. However, the writing is very small and hard to read (either that or I'm going blind ) and I wonder if there is a way to make them big, bold and easily readable.
Ignored
I'll look into seeing if I am able to edit the font size, and I'll get back to you with the results.

Edit: This appears to be a hard-coded limitation of MT4. I can't find a way to increase the font size, sorry. I'm guessing you're running some sort of redonculous resolution which would make it harder to read.
 
 
  • Trading Systems
  • /
  • Fozzy Alt... one more approach to the Daily Fozzy Method
  • Reply to Thread
    • Page 1 2 3
    • Page 1 2 3
0 traders viewing now
  • More
Top of Page
  • Facebook
  • Twitter
About FF
  • Mission
  • Products
  • User Guide
  • Media Kit
  • Blog
  • Contact
FF Products
  • Forums
  • Trades
  • Calendar
  • News
  • Market
  • Brokers
  • Trade Explorer
FF Website
  • Homepage
  • Search
  • Members
  • Report a Bug
Follow FF
  • Facebook
  • Twitter

FF Sister Sites:

  • Metals Mine
  • Energy EXCH
  • Crypto Craft

Forex Factory® is a brand of Fair Economy, Inc.

Terms of Service / ©2022